- Research Article
- Open access
- Published:
DOA Estimation with Local-Peak-Weighted CSP
EURASIP Journal on Advances in Signal Processing volume 2010, Article number: 358729 (2010)
Abstract
This paper proposes a novel weighting algorithm for Cross-power Spectrum Phase (CSP) analysis to improve the accuracy of direction of arrival (DOA) estimation for beamforming in a noisy environment. Our sound source is a human speaker and the noise is broadband noise in an automobile. The harmonic structures in the human speech spectrum can be used for weighting the CSP analysis, because harmonic bins must contain more speech power than the others and thus give us more reliable information. However, most conventional methods leveraging harmonic structures require pitch estimation with voiced-unvoiced classification, which is not sufficiently accurate in noisy environments. In our new approach, the observed power spectrum is directly converted into weights for the CSP analysis by retaining only the local peaks considered to be harmonic structures. Our experiment showed the proposed approach significantly reduced the errors in localization, and it showed further improvements when used with other weighting algorithms.
1. Introduction
The performance of automatic speech recognition (ASR) is severely affected in noisy environments. For example, in automobiles the ASR error rates during high-speed cruising with an open window are generally high. In such situations, the noise reduction of beamforming technology can improve the ASR accuracy. However, all beamformers except for Blind Signal Separation (BSS) require accurate localization to focus on the target sound source. If a beamformer has high performance with acute directivity, then the performance declines greatly if the localization is inaccurate. This means ASR may actually lose accuracy with a beamformer, if the localization is poor in a noisy environment. Accurate localization is critically important for ASR with a beamformer.
For sound source localization, conventional methods include MUSIC [1, 2], Minimum Variance (MV), Delay and Sum (DS), and Cross-power Spectrum Phase (CSP) [3] analysis. For two-microphone systems installed on physical objects such as dummy heads or external ears, approaches with head-related transfer functions (HRTF) have been investigated to model the effect of diffraction and reflection [4]. Profile Fitting [5] can also address the diffraction and reflection with the advantage of reducing the effects of noise sources through localization.
Among these methods, CSP analysis is popular because it is accurate, reliable, and simple. CSP analysis measures the time differences in the signals from two microphones using normalized correlation. The differences correspond to the direction of arrival (DOA) of the sound sources. Using multiple pairs of microphones, CSP analysis can be enhanced for 2D or 3D space localization [6].
This paper seeks to improve CSP analysis in noisy environments with a special weighting algorithm. We assume the target sound source is a human speaker and the noise is broadband noise such as a fan, wind, or road noise in an automobile. Denda et al. proposed weighted CSP analysis using average speech spectrums as weights [7]. The assumption is that a subband with more speech power conveys more reliable information for localization. However, it did not use the harmonic structures of human speech. Because the harmonic bins must contain more speech power than the other bins, they should give us more reliable information in noisy environments. The use of harmonic structures for localization has been investigated in prior art [8, 9], but not for CSP analysis. This work estimated the pitches (F0) of the target sound and extracted localization cues from the harmonic structures based on those pitches. However, the pitch estimation and the associated voiced-unvoiced classification may be insufficiently accurate in noisy environments. Also, it should be noted that not all harmonic bins have distinct harmonic structures. Some bins may not be in the speech formants and be dominated by noise. Therefore, we want a special weighting algorithm that puts larger weights on the bins where the harmonic structures are distinct, without requiring explicit pitch detection and voiced-unvoiced classification.
2. Sound Source Localization Using CSP Analysis
2.1. CSP Analysis
CSP analysis measures the normalized correlations between two-microphone inputs with an Inverse Discrete Fourier Transform (IDFT) as

where  is a complex spectrum at the T th frame observed with microphone m and
  means complex conjugate. The bin number
  corresponds to the frequency. The CSP coefficient
  is a time-domain representation of the normalized correlation for the i-sample delay. For a stable representation, the CSP coefficients should be processed as a moving average using several frames around T, as long as the sound source is not moving, using

where  is the number of averaged frames. Figure 1 shows an example of
  . In clean conditions, there is a sharp peak for a sound source. The estimated DOA
  for the sound source is

An example of CSP.

2.2. Tracking a Moving Sound Source
If a sound source is moving, the past location or DOA can be used as a cue to the new location. Tracking techniques may use Dynamic Programming (DP), the Viterbi search [10], Kalman Filters, or Particle Filters [11]. For example, to find the series of DOAs that maximize the function for the input speech frames, DP can use the evaluation function  as
as

where  is a cost function from
  to
to  .
.
2.3. Weighted CSP Analysis
Equation (1) can be viewed as a summation of each contribution at bin  . Therefore we can introduce a weight
  on each bin so as to focus on the more reliable bins, as

Denda et al. introduced an average speech spectrum for the weights [7] to focus on human speech. Figure 2 shows their weights. We use the symbol  for later reference to these weights. It does not have any suffix T, since it is time invariant.

Average speech spectrum weight.
Another weighting approach would be to use the local SNR [12], as long as the ambient noise is stationary and measurable. For our evaluation in Section 4, we simply used larger weights where local SNR is high as

where  is the spectral magnitude of the average noise,
  is a very small constant, and
  is a normalizing factor

Figure 3(c) shows an example of the local SNR weights.

Sample spectra and the associated weights. The spectra were of the recording with air conditioner noise at an SNR of 0 dB. The noisy speech spectrum (b) was sampled in a vowel segment.A sample of the average noise spectrum.A sample of the observed noisy speech spectrum.A sample of the local SNR weights.A sample of the local peak weights.
3. Harmonic Structure-Based Weighting
3.1. Comb Weights
If there is accurate information about the pitch and voiced-unvoiced labeling of the input speech, then we can design comb filters [13] for the frames in the voiced segments. The optimal CSP weights will be equivalent to the gain of the comb filters to selectively use those harmonic bins. Figure 4 shows an example of the weights when the pitch is 300 Hz.

A Sample of comb weight. (pitch = 300 Hz).
Unfortunately, the estimates of the pitch and the voiced-unvoiced classification become inaccurate in noisy environments. Figure 5 shows our tests using the "Pitch command" in SPTK-3.0 [14] to obtain the pitch and voiced-unvoiced information. There are many outliers in the low SNR conditions. Many researchers have tried to improve the accuracy of the detection in noisy environments [15], but their solutions require some threshold for voiced-unvoiced classification [16]. When noise-corrupted speech is falsely detected as unvoiced, there is little benefit from the CSP weighting.

A sample waveform (clean) and its pitches detected by SPTK in various SNR situations. The threshold of voiced-unvoiced classification was set to 6.0 (SPTK default). For the frames detected as unvoiced, SPTK outputs zero. The test data was prepared by blending noise at different SNRs. The noise was recorded in a car moving on an expressway with a fan at a medium level.
There is another problem with the uniform adoption of comb weights for all of the bins. Those bins not in the speech formants and degraded by noise may not contain reliable cues even though they are harmonic bins. Such bins should receive smaller weights.
Therefore, in Section 3.2, we explore a new weighting algorithm that does not depend on explicit pitch detection or voiced-unvoiced classification. Our approach is like a continuous converter from an input spectrum to a weight vector, which can be locally large for the bins whose harmonic structures are distinct.
3.2. Proposed Local Peak Weights
We previously proposed a method for speech enhancement called Local Peak Enhancement (LPE) to provide robust ASR even in very low SNR conditions due to driving noises from an open window or loud air conditioner noises [17]. LPE does not leverage pitch information explicitly, but estimates the filters from the observed speech to enhance the speech spectrum. LPE assumes that pitch information containing the harmonic structure is included in the middle range of the cepstral coefficients obtained with the discrete cosine transform (DCT) from the power spectral coefficients. The LPE filter retrieves information only from that range, so it is designed to enhance the local peaks of the harmonic structures for voiced speech frames. Here, we propose the LPE filter be used for the weights in the CSP approach. This use of the LPE filter is named Local Peak Weight (LPW), and we refer to the CSP with LPW as the Local-Peak-Weighted CSP (LPW-CSP).
Figure 6 shows all of the steps for obtaining the LPW and sample outputs of each step for both a voiced frame and an unvoiced frame. The process is the same for all of the frames, but the generated filters differ depending on whether or not the frame is voiced speech, as shown in the figure.

Process to obtain Local Peak Weight.
Here are the details for each step.
-
(1)
Convert the observed spectrum from one of the microphones to a log power spectrum
 for each frame, where T and j are the frame number and the bin index of the DFT. Optionally, we may take a moving average using several frames around T, to smooth the power spectrum for
  .
. -
(2)
Convert the log power spectrum
 into the cepstrum
  by using
  , a DCT matrix.
 (8)
(8)where i is the bin number of the cepstral coefficients. In our experiments, the size of the DCT matrix is 256 by 256.
-
(3)
The cepstra represent the curvatures of the log power spectra. The lower and higher cepstra include long and short oscillations while the medium cepstra capture the harmonic structure information. Thus the range of cepstra is chosen by filtering out the lower and upper cepstra in order to cover the possible harmonic structures in the human voice.
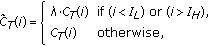 (9)
(9)where
 is a small constant. I
L
and I
H
correspond to the bin index of the possible pitch range, which for human speech is from 100 Hz to 400 Hz. This assumption gives I
L
= 55 and I
H
= 220, when the sampling frequency is 22 kHz.
is a small constant. I
L
and I
H
correspond to the bin index of the possible pitch range, which for human speech is from 100 Hz to 400 Hz. This assumption gives I
L
= 55 and I
H
= 220, when the sampling frequency is 22 kHz. -
(4)
Convert
 back to the log power spectrum domain
  by using the inverse DCT:
 (10)
(10) -
(5)
Then converted back to a linear power spectrum:
 (11)
(11) -
(6)
Finally, we obtain LPW, after normalizing, as
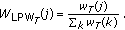 (12)
(12)
 for each frame, where T and j are the frame number and the bin index of the DFT. Optionally, we may take a moving average using several frames around T, to smooth the power spectrum for
  .
. into the cepstrum
  by using
  , a DCT matrix.

 is a small constant. I
L
and I
H
correspond to the bin index of the possible pitch range, which for human speech is from 100 Hz to 400 Hz. This assumption gives I
L
= 55 and I
H
= 220, when the sampling frequency is 22 kHz.
is a small constant. I
L
and I
H
correspond to the bin index of the possible pitch range, which for human speech is from 100 Hz to 400 Hz. This assumption gives I
L
= 55 and I
H
= 220, when the sampling frequency is 22 kHz. back to the log power spectrum domain
  by using the inverse DCT:


For voiced speech frames, LPW will be designed to retain only the local peaks of the harmonic structure as shown in the bottom-right graph in Figure 6 (see also Figure 3(d)) For unvoiced speech frames, the result will be almost flat due to the lack of local peaks with the target harmonic structure. Unlike the comb weights, the LPW is not uniform over the target frequencies and is more focused on the frequencies where harmonic structures are observed in the input spectrum.
3.3. Combination with Existing Weights
The proposed LPW and existing weights can be used in various combinations. For the combinations, the two choices are sum and product. In this paper, they are defined as the products of each component for each bin j, because the scale of each component is too different for a simple summation and we hope to minimize some fake peaks in the weights by using the products of different metrics. Equations (13) to (16) show the combinations we evaluate in Section 4.


4. Experiment
In the experimental car, two microphones were installed near the map-reading lights on the ceiling with 12.5 cm between them. We used omnidirectional microphones. The sampling frequency for the recordings was 22 kHz. In this configuration, CSP gives 15 steps from  to
to  for the DOA resolution (see Figure 7).

Microphone installation and the resolution of DOA in the experimental car.
A higher sampling rate might yield higher directional resolution. However, many beamformers do not support higher sampling frequencies because of processing costs and aliasing problems. We also know that most ASR systems work at sampling rates below 22 kHz. These considerations led us to use 22 kHz.
Again, we could have gained directional resolution by increasing the distance between the microphones. In general, a larger baseline distance improves the performance of a beamformer, especially for lower frequency sounds. However, this increases the aliasing problems for higher frequency sounds. Our separation of 12.5 cm was another tradeoff.
Our analysis used a Hamming window, 23-ms-long frames with 10-ms frame shifts. The FFT length was 512. For (2), the length of the moving average was 0.2 seconds.
The test subject speakers were 4 females and 4 males. Each speaker read 50 Japanese commands. These are short phrases for automobiles known as Free Form Command [18]. The total number of utterances was 400. They were recorded in a stationary car, a full-size sedan. The subject speakers sat in the driver's seat. The seat was adjusted to each speaker's preference, so the distance to the microphones varied from approximately 40 cm to 60 cm. Two types of noise were recorded separately in a moving car, and they were combined with the speech data at various SNRs (clean, 10 dB, and 0 dB). The SNRs were measured as ratios of speech power and noise power, ignoring the frequency components below 300 Hz. One of the recorded noises was an air-conditioner at maximum fan speed while driving on a highway with the windows closed. This will be referred to as "Fan Max". The other was of driving noise on a highway with the windows fully opened. This will be referred to as "Window Full Open". Figure 8 compares the average spectra of the two noises. "Window Full Open" contains more power around 1 kHz, and "Fan Max" contains relatively large power around 4 kHz. Although it is not shown in the graph, "Window Full Open" contains lots of transient noise from the wind and other automobiles.

Averaged noise spectrum used in the experiment.
Figure 9 shows the system used for this evaluation. We used various types of weights for the weighted CSP analysis. The input from one microphone was used to generate the weights. Using both microphones could provide better weights, but in this experiment we used only one microphone for simplicity. Since the baseline (normal CSP) does not use weighting, all of its weights were set to 1.0. The weighted CSP was calculated using (5), with smoothing over the frames using (2). In addition to the weightings, we introduced a lower cut-off frequency of 100 Hz and an upper cut-off frequency of 5 kHz to stabilize the CSP analysis. Finally, the DOA was estimated using (3) for each frame. We did not use the tracking algorithms discussed in Section 2.2, because we wanted to accurately measure the contributions of the various types of weights in a simplified form. Actually, the subject speakers rarely moved when speaking.

System for the evaluation.
The performance was measured as frame-based accuracy. The frames reporting the correct DOA were counted, and that was divided by the total number of speech frames. The correct DOA values were determined manually. The speech segments were determined using clean speech data with a rather strict threshold, so extra segments were not included before or after the phrases.
4.1. Experiment Using Single Weights
We evaluated five types of CSP analysis.
Case 1.
Normal CSP (uniform weights, baseline).
Case 2.
Comb-Weighted CSP.
Case 3.
Local-Peak-Weighted CSP (our proposal).
Case 4.
Local-SNR-Weighted CSP.
Case 5.
Average-Speech-Spectrum-Weighted CSP (Denda).
Case 2 requires the pitch and voiced-unvoiced information. We used SPTK-3.0 [14] with default parameters to obtain this data. Case 4 requires estimating the noise spectrum. In this experiment, the noise spectrum was continuously updated within the noise segments based on oracle VAD information as

The initial value of the noise spectrum for each utterance file was given by the average of all of the noise segments in that file.
Figures 10 and 11 show the experimental results for "Fan Max" and "Window Full Open", respectively. Case 2 failed to show significant error reduction in both situations. This failure is probably due to bad pitch estimation or poor voiced-unvoiced classification in the noisy environments. This suggests that the result could be improved by introducing robust pitch trackers and voiced-unvoiced classifiers. However, there is an intrinsic problem since noisier speech segments are more likely to be classified as unvoiced and thus lose the benefit of weighting.

Error rate of frame-based DOA detection. (Fan Max: single-weight cases).

Error rate of frame-based DOA detection. (Window Full Open: single-weight cases).
Case 5 failed to show significant error reduction for "Fan Max", but it showed good improvement for "Window Full Open". As shown in Figure 8, "Fan Max" contains more noise power around 4 kHz than around 1 kHz. In contrast, the speech power is usually lower around 4 kHz than around 1 kHz. Therefore, the 4-kHz region tends to be more degraded. However Denda's approach does not sufficiently lower the weights in the 4-kHz region, because the weights are time-invariant and independent on the noise. Case 3 and Case 4 outperformed the baseline in both situations. For "Fan Max", since the noise was almost stationary, the local-SNR approach can accurately estimate the noise. This is also a favorable situation for LPW, because the noise does not include harmonic components. However, LPW does little for consonants. Therefore, Case 4 had the best results for "Fan Max". In contrast, since the noise is nonstationary for "Window Full Open", Case 3 had slightly fewer errors than Case 4. We believe this is because the noise estimation for the local SNR calculations is inaccurate for nonstationary noises. Considering that the local SNR approach in this experiment used the given and accurate VAD information, the actual performance in the real world would probably be worse than our results. LPW has an advantage in that it does not require either noise estimation or VAD information.
4.2. Experiment Using Combined Weights
We also evaluated some combinations of the weights in Cases 3 to 5. The combined weights were calculated using (13) to (16).
Case 6.
CSP weighted with LPW and Denda (Cases 3 and 5).
Case 7.
CSP weighted with LPW and Local SNR (Cases 3 and 4).
Case 8.
CSP weighted with Local SNR and Denda (Cases 4 and 5).
Case 9.
CSP weighted with LPW, Local SNR, and Denda (Cases 3, 4, and 5).
Figures 12 and 13 show the experimental results for "Fan Max" and "Window Full Open", respectively, for the combined weight cases.

Error rate of frame-based DOA detection. (Fan Max: combined-weight cases).

Error rate of frame-based DOA detection. (Window Full Open: combined-weight cases).
For the combination of two weights, the best combination was dependent on the situation. For "Fan Max", Case 7, the combination of LPW and the local SNR approach was best in reducing the error by 51% for 0 dB. For "Window Full Open", Case 6, the combination of LPW and Denda's approach was best in reducing the error by 37% for 0 dB. These results correspond to the discussion in Section 4.1 about how the local SNR approach is suitable for stationary noises, while LPW is suitable for nonstationary noises, and Denda's approach works well with noise concentrated in the lower frequency region.
Case 9, the combination of the three weights worked well in both situations. Because each weighting method has different characteristics, we expected that their combination would help against variations in the noise. Actually, the results were almost equivalent to the best combinations of the paired weights in each situation.
5. Conclusion
We proposed a new weighting algorithm for CSP analysis to improve the accuracy of DOA estimation for beamforming in a noisy environment, assuming the source is human speech and the noise is broadband noise such as a fan, wind, or road noise in an automobile.
The proposed weights are extracted directly from the input speech using the midrange of the cepstrum. They represent the local peaks of the harmonic structures. As the process does not involve voiced-unvoiced classification, it does not have to switch its behavior over the voiced- unvoiced transitions.
Experiments showed the proposed local peak weighting algorithm significantly reduced the errors in localization using CSP analysis. A weighting algorithm using local SNR also reduced the errors, but it did not produce the best results in the nonstationary noise situation in our evaluations. Also, it requires VAD information to estimate the noise spectrum. Our proposed algorithm does not require VAD information, voiced-unvoiced information, or pitch information. It does not assume the noise is stationary. Therefore, it showed advantages in the nonstationary noise situation. Also, it can be combined with existing weighting algorithms for further improvements.
References
Johnson D, Dudgeon D: Array Signal Processing. Prentice-Hall, Englewood Cliffs, NJ, USA;
Asano F, Asoh H, Matsui T: Sound source localization and separation in near field. IEICE Transactions on Fundamentals of Electronics, Communications and Computer Sciences 2000, E83-A(11):2286-2294.
Omologo M, Svaizer P: Acoustic event localization using a crosspower-spectrum phase based technique. Proceedings of the International Conference on Acoustics, Speech, and Signal Processing (ICASSP '94), 1994 273-276.
Martin KD: Estimating azimuth and elevation from interaural differences. Proceedings of IEEE ASSP Workshop on Applications of Signal Processing to Audio and Acoustics (WASPAA '95), 1995 4.
Ichikawa O, Takiguchi T, Nishimura M: Sound source localization using a profile fitting method with sound reflectors. IEICE Transactions on Information and Systems 2004, E87-D(5):1138-1145.
Nishiura T, Yamada T, Nakamura S, Shikano K: Localization of multiple sound sources based on a CSP analysis with a microphone array. Proceedings of IEEE International Conference on Acoustics, Speech and Signal Processing (ICASSP '00), 2000 2: 1053-1056.
Denda Y, Nishiura T, Yamashita Y: Robust talker direction estimation based on weighted CSP analysis and maximum likelihood estimation. IEICE Transactions on Information and Systems 2006, E89-D(3):1050-1057. 10.1093/ietisy/e89-d.3.1050
Yamada T, Nakamura S, Shikano K: Robust speech recognition with speaker localization by a microphone array. Proceedings of the International Conference on Spoken Language Processing (ICSLP '96), 1996 3: 1317-1320.
Nagai T, Kondo K, Kaneko M, Kurematsu A: Estimation of source location based on 2-D MUSIC and its application to speech recognition in cars. Proceedings of IEEE International Conference on Acoustics, Speech and Signal Processing (ICASSP '01), 2001 5: 3041-3044.
Yamada T, Nakamura S, Shikano K: Distant-talking speech recognition based on a 3-D Viterbi search using a microphone array. IEEE Transactions on Speech and Audio Processing 2002, 10(2):48-56. 10.1109/89.985542
Asoh H, Hara I, Asano F, Yamamoto K: Tracking human speech events using a particle filter. Proceedings of IEEE International Conference on Acoustics, Speech and Signal Processing (ICASSP '05), 2005 2: 1153-1156.
Valin J-M, Michaud F, Rouat J, Létourneau D: Robust sound source localization using a microphone array on a mobile robot. Proceedings of IEEE International Conference on Intelligent Robots and Systems (IROS '03), 2003 2: 1228-1233.
Tolba H, O'Shaughnessy D: Robust automatic continuous-speech recognition based on a voiced-unvoiced decision. Proceedings of the International Conference on Spoken Language Processing (ICSLP '98), 1998 342.
Wu M, Wang DL, Brown GJ: A multi-pitch tracking algorithm for noisy speech. Proceedings of IEEE International Conference on Acoustics, Speech and Signal Processing (ICASSP '02), 2002 1: 369-372.
Nakatani T, lrino T, Zolfaghari P: Dominance spectrum based V/UV classification and F0 estimation. Proceedings of the 8th European Conference on Speech Communication and Technology (Eurospeech '03), 2003 2313-2316.
Ichikawa O, Fukuda T, Nishimura M: Local peak enhancement combined with noise reduction algorithms for robust automatic speech recognition in automobiles. Proceedings of IEEE International Conference on Acoustics, Speech and Signal Processing (ICASSP '08), 2008 4869-4872.
Author information
Authors and Affiliations
Corresponding author
Rights and permissions
Open Access This article is distributed under the terms of the Creative Commons Attribution 2.0 International License (https://creativecommons.org/licenses/by/2.0), which permits unrestricted use, distribution, and reproduction in any medium, provided the original work is properly cited.
About this article
Cite this article
Ichikawa, O., Fukuda, T. & Nishimura, M. DOA Estimation with Local-Peak-Weighted CSP. EURASIP J. Adv. Signal Process. 2010, 358729 (2010). https://doi.org/10.1155/2010/358729
Received:
Revised:
Accepted:
Published:
DOI: https://doi.org/10.1155/2010/358729