- Research Article
- Open access
- Published:
Digital Watermarking Method Warranting the Lower Limit of Image Quality of Watermarked Images
EURASIP Journal on Advances in Signal Processing volume 2010, Article number: 426085 (2010)
Abstract
We propose a digital watermarking method warranting the lower limit of the image quality of watermarked images. The proposed method controls the degradation of a watermarked image by using a lower limit image. The lower limit image means the image of the worst quality that users can permit. The proposed method accepts any lower limit image and does not require it at extraction. Therefore lower limit images can be decided flexibly. In this paper, we introduce 2-dimensional human visual MTF model as an example of obtaining lower limit images. Also we use JPEG-compressed images of quality 75% and 50% as lower limit images. We investigate the performance of the proposed method by experiments. Moreover we compare the proposed method using three types of lower limit images with the existing method in view of the tradeoff between PSNR and the robustness against JPEG compression.
1. Introduction
Digital watermarking is a technique that embeds additional data into digital contents so that the distortion by embedding them is perceptually undetectable [1]. The distortion of watermarked images by general digital watermarking methods is fixed only after embedding. Some digital watermarking methods [2] prevent the degradation of the image quality of watermarked images by using human visual system. However the lower limit of the image quality of the watermarked images was not clear. Such obscurity of the lower limit disturbs the practical use of digital watermarking.
The method proposed by Yoshiura and Echizen [2] decided the embedding strength by introducing uniform color space so that the degradation of all regions in a image was equalized. However there is the fact that the degradation by modification in uniform color space depends on the direction of the modification described in Section 2.
In this paper, we propose a digital watermarking method warranting the lower limit of the image quality of watermarked images. The proposed method controls the degradation of a watermarked image by using a lower limit image. The lower limit image means the image of the worst quality that users can permit. The proposed method accepts any lower limit image and does not require it at extraction. Therefore lower limit images can be decided flexibly. In this paper, we introduce 2-dimensional human visual MTF model as an example of obtaining lower limit images. Also we use JPEG-compressed images of quality 75% and 50% as lower limit images, which are popular formats as degraded images.
The rest of this paper consists of five sections. We describe our approach in Section 2 and introduce the existing techniques in Section 3. Then we describe the detail of the proposed method in Section 4 and show and discuss the performance of the proposed method in Section 5. Finally we conclude this paper in Section 6.
2. Our Approach
We assume that there is a range in which the changes for pixel values are imperceptible. We call the range "perceptual capacity." Existing methods do not modify pixel values in the perceptual capacity strictly. Therefore we introduce a lower limit image which means the image of the worst quality that users can permit, that is, which provides with perceptual capacity. The contribution of the introduction of lower limit images is the separation of perceptual capacity and watermarking procedures. The separation yields the independence of investigation.
The proposed method warrants the lower limit of the image quality of a watermarked image by approximating an original image to the corresponding lower limit image for embedding. Moreover we introduce L a
a b
b color space for equalizing the degradation by embedding, where L
 a
a b
b color space is one of the popular uniform color spaces. Then the quality of a watermarked image is between that of the original image and that of the lower limit image in L
 a
a b
b color space. The lower limit image can be decided flexibly because the proposed method does not require it at extraction.
In general, the modification with the same quantity in a uniform color space perceptually yields the same degradation. However the direction of the modification is important, too. We found this fact by comparing the degradation of the modified images approaching human visual filtered images with that of the modified images leaving the filtered images, where the modification was done in L a
a b
b color space. The human visual filter cuts off redundant component for visual sensation. Figure 1 shows the difference in quality by the direction of modification, where the human visual filter used here is mathematical 2-dimensional human visual MTF model described in Section 3.2.2. As shown in Figure 1, the degradation of the modified image approaching the filtered image is more imperceptible than that of the modified image leaving the filtered image. We utilize this feature by employing the images filtered by mathematical 2-dimensional human visual MTF model as one of the types of lower limit images. Also we use JPEG compressed images of quality 75% and 50% as lower limit images, which are popular formats as degraded images. In other words, employing the MTF model is a theoretical approach to generate lower limit images, while using JPEG-compression is a practical approach.

Difference by the direction of modification.
3. Existing Techniques
3.1. Color Spaces
In this section, we describe XYZ color space, L a
a b
b color space, and opponent color space in Sections 3.1.1, 3.1.2, and 3.1.3, respectively.
3.1.1. XYZ Color Space
XYZ color space is a color space established by CIE (Commission Internationale de l'Eclairage) in 1931. The transformation of sRGB color space into XYZ color space is as follows [3].
First we obtain gamma-transformed sRGB color space by the following equations:

where  ,
,  and
and  are the values in gamma-transformed sRGB color space, and
  ,
,  and
and  are the values in sRGB color space.
Then we obtain XYZ color space from gamma-transformed sRGB color space by the following equations:

3.1.2. L a
a b
b Color Space
 a
a b
b Color Space
L a
a b
b color space is one of uniform color spaces established by CIE in 1976 [4]. In a uniform color space, the distances between colors are fixed based on the perceptual differences between the colors [3, 5, 6].
L a
a b
b color space is obtained from XYZ color space by the following equations:

where  ,
,  and
and  are coefficients which depend upon the illuminant (for daylight illuminant D65,
  ,
,  and
and  ).
).
3.1.3. Opponent Color Space
Opponent color space is based on input signals from L cone, M cone, and S cone in retina. Opponent color space is obtained from XYZ color space by the following equation:

where  ,
,  , and
, and  represent luminance channel and the opponent channels of red-green and yellow-blue, respectively.
3.2. Two-Dimensional Human Visual MTF Model
3.2.1. Modulation Transfer Function
Modulation Transfer Function (MTF) describes the relationship between spacial frequency and contrast sensitivity. Spatial frequency is a measure of how often a structure repeats per unit of distance. As shown in Figure 2, any pattern corresponds to the spacial frequency. On the other hand, contrast sensitivity is a measure of the ability to discern luminances of different levels in a static image. Contrast sensitivity depends on spatial frequency. For example, it tends to be high for medium spatial frequency, while it tends to be low for high spatial frequency.

Patterns with low spatial frequency and high spatial frequency.
Figure 3 shows the shape of human visual MTF for luminance. As shown in Figure 3, contrast sensitivity is numerically expressed by MTF. In human visual MTF for luminance, contrast sensitivity is high for medium spatial frequency and is suddenly low for high spatial frequency. It is known that the shape of human visual MTF for other color stimulus is similar to that for luminance.

Shape of human visual MTF for luminance.
3.2.2. Mathematical 2-Dimensional Human Visual MTF Model
Ishihara et al. [7, 8] and Miyake [9] revealed that human visual MTF depends on directivity in spatial frequency and mean of stimulus. Moreover they proposed mathematical 2-dimensional human visual MTF model about tristimulus on opponent color space.
Let  be horizontal and vertical spatial frequency, respectively, let
  be the spatial frequency on
  -
- plane, and let
  be the direction of
  . Then contrast sensitivity
  obtained by mathematical 2-dimensional human visual MTF model is defined as follows:

where  represents the ratio of diagonal contrast sensitivity to horizontal contrast sensitivity when the horizontal spatial frequency is equal to
  , and
, and  is defined as follows:

where  represents the maximum value of horizontal contrast sensitivity on human visual MTF when the mean of stimulus is equal to
  .
.
We define  and
and  as contrast sensitivity
  for red-green channel and yellow-blue channel, respectively. We can obtain
  and
and  from (5) using the parameters shown in Table 1. The parameters
  ,
,  ,
,  and
and  in Table 1 are calculated by the following equations:

where  and
and  represent the means of all
  and
and  in an image, respectively. In the literature [7–9],
  is not calculated when
  . For the correction of this incident, we regard
  as
as  when
when  so as to obey the meaning of contrast sensitivity. Figure 4 shows the shapes of
  and
and  with or without the correction.

Shapes of
 and
and
 .
.
3.3. Filtering Based on Two-dimensional Human Visual MTF Model
The filter of 2-dimensional human visual MTF model cuts aoff imperceptible components from images. In this paper, only red-green and yellow-blue channels are filtered, which are based on the characteristic that modification in luminance is more perceptual than that in red-green or yellow-blue channel.
Step 1.
An original image with  pixels is transformed into opponent color space. Let
  and
and  be the values of red-green and yellow-blue channels located at the coordinate
  respectively.
Step 2.
 and
and  are transformed into
  and
and  by discrete Fourier transform (DFT), respectively.
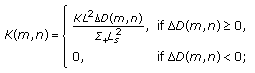
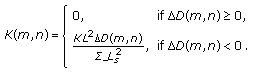
Step 3.
The filtered discrete Fourier transform coefficients  and
and  are, respectively, obtained by the following equations:

Step 4.
The filtered pixel values in opponent color space are obtained from  and
and  by inverse DFT. Then the lower limit image is obtained by the transformation of opponent color space into sRGB color space.
4. Proposed Method
4.1. Embedding Procedure
Firstly we divide an original image with  pixels and the corresponding lower limit image into blocks with
  pixels. Moreover the blocks are divided into subblocks with
  pixels. Let
  and
and  be the
  -th block in the original image and the lower limit image, respectively, where
  ,
,  . Let
. Let  and
and  be the
  -th subblock in
  and
and  respectively, where
  ,
,  ("
(" " is omitted in the representation of
  and
and  for simplicity). The proposed method embeds one watermark bit into one block. Let
  be the watermark bit embedded in
  .
.
The embedding procedure of  is as follows.
Step 1.
Let  be the pixel value located at
  in
in  , where
  . Then the pixel value
  is regarded as the point
  in L
in L a
a b
b color space. In the same manner,
  and
and  are defined from
  .
.
Step 2.
Let  be the distance between the origin
  and the point
  , and let
  be the distance between the origin
  and the point
  .
.  and
and  are obtained by the following:equations:

Step 3.
The difference  between the norms of the pixels in the original image and the lower limit image is obtained by the following equation:

Moreover the sum  of positive values and the sum
  of negative values in
  are obtained as follows:

Step 4.
The sum  of
of  in
in  is obtained by the following equation:

Step 5.
The mean  of the sums
  of all subblocks in
  is obtained by the following equation:

Step 6.
The quantized mean  is obtained by the following equation:

where  means the maximum integer which is smaller than
  . The quantizer
  acts as embedding strength.
Step 7.
The quantized mean  will be modified so as to be even when
  and be modified so as to be odd when
  by the following steps (Step 7~Step 9).
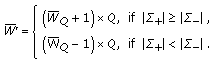
The watermarked value  of the quantized mean is obtained as follows:
-
(i)
when
 ,
,  (15)
(15) -
(ii)
when
 ,
,  (16)
(16)
 ,
, 
 ,
, 
Moreover we obtain the quantity  which is added to
  for embedding by the following equation:

Step 8.
We obtain the quantity  which is added to each pixel value
  in
in  for embedding as follows:
-
(i)
when
 ,
,  (18)
(18) -
(ii)
when
 ,
,  (19)
(19)
 ,
, 
 ,
, 
Step 9.
Let  be the watermarked point of
  . As shown in Figure 5, we change
  into
into  so as to satisfy
  by the following equation:

where  is the ratio for changing of
  into
into  . The ratio
  satisfies
  and the following equation:

where  , and
, and  are obtained by the following equation:


Modification
 into
into
 .
.
Step 10.
The watermarked points  are transformed into sRGB color space, where the transformation of real numbers into integers (round-up or round-down) is decided so that the influence on
  is minimized. Then we obtain the watermarked block
  .
.
We obtain the watermarked image after all watermark bits have been embedded.
4.2. Extracting Procedure
Firstly we obtain the blocks  and the subblocks
  from a watermarked image in the same manner as embedding procedure.
The extracting procedure for a block  is as follows.
Step 1.
The pixel values  in
in  are transformed into L
 a
a b
b color space and are regarded as the points
  in L
in L a
a b
b color space.
Step 2.
The sum  of
of  in
in  is obtained for each sub-block in the same manner as (12).
Step 3.
The mean  of the sums
  of all subblocks in
  is obtained in the same manner as (13).
Step 4.
The quantized mean  is obtained in the same manner as (14). Then we extract
  as follows:

We obtain all the watermark bits after extracting for all blocks.
5. Experiments
5.1. Environments
Firstly we investigated the image quality of watermarked images and lower limit images. Then we confirmed that embedded watermark bits were perfectly extracted from watermarked images. Next we investigated the available range of the embedding strength  because the embedding strength should be decided so that the ratio
  can exist. Moreover we investigated the property of the proposed method when the embedding strength
  was variable for each block. The variable embedding strength was the maximum value for each block. Finally we investigated the robustness against JPEG compression and the comparison with an existing method in view of image quality and robustness.
As shown in Figure 6 we used twelve color images "aerial," "airplane," "balloon," "couple," "earth," "girl," "lena," "mandrill," "milkdrop," "parrots," "pepper", and "sailboat" as original images. They were standard images widely used for experiments. The size of all original images was 256  256 pixels, that is,
  , and
, and  . We used
  and
and  as the size of blocks and subblocks, respectively. All the watermark bits
  were decided so as to satisfy
  . Then the watermarked images that used such watermark bits were worst degraded among those that used any watermark bit. We used
  as the embedding strength so that the ratio
  in Step 9 in Section 4.1 could exist, where
  represents the minimum value of the larger ones of
  and
and  in each block. The lower limit images consist of three types, that is, "MTF" which is described in Section 3.2, and "JPEG75" and "JPEG50" which are JPEG-compressed images of quality 75% and 50%. The quality 75% of JPEG compression is the standard quality.

Original images.
We used PSNR for the evaluation of image quality. PSNR was calculated by the following equation:

where  and
and  represent the pixels in one image and the other image, respectively. We also used mean structural similarity (MSSIM) index [10] to evaluating the similarity between watermarked images and lower limit images. MSSIM index is obtained by calculating the mean of SSIM indices of all windows on the images. SSIM index between two window
  and
and  of size
  pixels was calculated by the following equation:

where  and
and  represent the means of
  and
and  respectively, and
  and
and  represent the variances of
  and
and  respectively. The constant values
  and
and  are defined as default values, that is,
  and
and  respectively.
5.2. Results and Discussion
5.2.1. Image Quality
Figures 7~9 show the watermarked images using "MTF," "JPEG75", and "JPEG50" as the lower limit images, respectively. As shown in Figure 7~9, the degradation of all the watermarked images was imperceptible.

Watermarked images (MTF).

Watermarked images (JPEG75).

Watermarked images (JPEG50).
Table 2 shows the PSNRs of the watermarked images and the lower limit images against the original images. As shown in Table 2, the PSNRs of the watermarked images except for "milkdrop" and "sailboat" are the lowest when the type of the lower limit images is "MTF." The PSNRs of the watermarked images "milkdrop" and "sailboat" using "MTF" are higher than those using "JPEG50," although the PSNRs of the lower limit images of type "MTF" are less than those of type "JPEG50." This suggests that the arbitrariness of the type of lower limit images is useful. Although the PSNRs of the watermarked images "aerial" and "mandrill" using "MTF" were less than 37 [dB] and were relatively low, the degradation of these images was imperceptible because these images mainly consisted of texture-like or noisy regions as shown in Figure 7.
5.2.2. Validity of Lower Limit Images
Figure 10 shows the lower limit images of type "MTF." As shown in Figure 10, the degradation of the lower limit images of type "MTF" appeared as emphasizing the difference of color, for example, the hair in "mandrill" or the profile of parrots in "parrots." Such degradation tends to be imperceptible. Therefore the images filtered by 2-dimensional human visual MTF model were appropriate for lower limit images in view of the direction of modification by embedding. However the lower limit images of type "MTF" were slightly inappropriate in view of the strength of modification by embedding because some degradation was perceptible as shown in Figure 10. Therefore one of the future works is the improvement of the decision of the embedding strength.

Lower limit images (MTF).
5.2.3. Flexibility of Embedding Strength
Table 3 shows the minimum and maximum of the embedding strength  . The minimum values of
  of "JPEG75" and "JPEG50" are similar to those of "MTF." The minimum of the embedding strength was fixed so that the embedded watermark could be perfectly extracted from the watermarked image. The maximum of the embedding strength was fixed so that the ratio
  could exist (the maximum of
  is equal to
  ). As shown in Table 3, the range of available
  depended on images. In "balloon" and "parrots," the flexibility of
  was low because the maximum of
  is equal to the minimum of
  . It is the future work to investigate the relationship between the range of available embedding strengths and the robustness against attacks.
 .
.5.2.4. Performance Using the Maximum of  of Each Block
 of Each Block
We investigated the property of the proposed method when the maximum of  (
( ) of each block is used; that is, embedding strength
  is variable by a block. The demerit of using the maximum of
  of each block is the increase of the quantity of data saved for extracting. In the following, we call the methods using the same
  and the maximum of
  "sameQ" and "maxQ", respectively. Note that the high maximum of
  in Table 3 does not always cause the low PSNR of the watermarked image of "maxQ" with such
  because the PSNR does not depend on the maximum of
  among all blocks but on the distribution of
  for each block when the maximum of
  of each block is used.
Figures 11~13 show the watermarked images using "MTF," "JPEG75", and "JPEG50" as the lower limit image, respectively. The embedding strength of all the watermarked images is "maxQ". Table 4 shows the PSNRs of watermarked images using the maximum of  of each block. The degradation of all the watermarked images using "JPEG75" and "JPEG50" was imperceptible. The degradation of the watermarked image "mandrill" using "MTF" was slightly perceptible as scattered green dots in the hair of mandrill. Table 4 shows the PSNRs of the watermarked images using "maxQ" as the embedding strength. Although PSNR of "airplane" using "MTF" is under 30 [dB], the degradation of "airplane" was imperceptible because the degradation was chromatic. On the other hand, although the degradation of "mandrill" was mainly texture-like chromatic noise on texture-like regions, the degradation of "mandrill" was slightly perceptible because the modification by embedding was large. We confirmed that the use of "MTF" caused not only the right direction of the modification by embedding but also too large modification by embedding. However we obtained practical results when we use "JPEG75" and "JPEG50" as the lower limit images.
 of each block.
Watermarked images (MTF, maxQ).
5.2.5. Similarity between Watermarked Images and Lower Limit Images
Table 5 shows the MSSIMs between watermarked images and lower limit images. As shown in Table 5, we confirmed that all the watermarked images were similar to the lower limit images because all the MSSIMs were high. It is natural that the MSSIMs of "maxQ" are larger than those of "sameQ" because the use of larger  yields the closer watermarked images to the lower limit images. It is the reason why the MSSIMs of "maxQ" are not 1.0 that there are some pixels of which
  are equal to 0 in (18) or (19).
5.2.6. Robustness against JPEG Compression
We define the number of correctly extracted bits divided by the number of all embedded bits as extraction rate. Tables 6 and 7 show the extraction rates in JPEG compression of quality 75% and 90%, respectively.
As shown in Table 6, the proposed method using "sameQ" had no robustness against JPEG compression of quality 75%. Using "maxQ," some extraction rates of "JPEG75"and "JPEG50" against JPEG compression of quality 75% were larger than 90%. It was noticeable that some extraction rates of "JPEG75" were larger than those of "JPEG50" although the PSNRs of "JPEG75" were larger than those of "JPEG50." The investigation of the relationship between lower limit images and robustness is one of our future works.
As shown in Table 7, the proposed method using "sameQ" had partial robustness against JPEG compression of quality 90%. On the other hand, almost all the extraction rates using "maxQ" were equal to 100%. Therefore the proposed method using "maxQ" had the robustness against JPEG compression of quality 90%.
5.2.7. Comparison with Existing Method
We use the existing method proposed by Yoshiura and Echizen in the literature [2] for comparison. Yoshiura's method used the correlation of 2-dimensional random sequences which was one of popular watermarking procedures. Moreover Yoshiura's method took into consideration human visual system by using L u
u v
v color space which was one of uniform color spaces. Therefore Yoshiura's method was appropriate to the comparison.
Figure 14 shows the original image "mandrill" and the watermarked images of the existing method and the proposed methods using "sameQ-MTF" and "maxQ-JPEG50." The PSNRs of the watermarked images were approximately equalized as described in Figure 14. As shown in Figure 14, chromatic block noises were perceptible in the watermarked image of the existing method, while the degradation was imperceptible in the watermarked images of the proposed methods using "sameQ-MTF" and "maxQ-JPEG50" although the PSNRs of of the proposed methods were lower than the PSNR of the existing method. Figure 15 shows the enlarged partial regions of the images in Figure 14. As shown in Figure 15, the degradation of each watermarked image was able to be observed in detail. The degradation of the existing method was chromatic block noise. The degradation of the proposed method using "sameQ-MTF" was strong chromatic edge enhancement. The degradation of the proposed method using "maxQ-JPEG50" was imperceptible even if the partial region was enlarged. It was the reason why the degradation of the proposed method using "maxQ-JPEG50" was not block noise that the location of the pixels modified by embedding was scattered by (18) and (19).
Figures 16~19 show the comparison of Yoshiura's method and the proposed method using "MTF," "JPEG75" or "JPEG50" as the lower limit images and "sameQ", or "maxQ" as the embedding strength. The horizontal axis of the graphs in Figures 16~19 represents PSNR[dB] of watermarked images, while the vertical axis represents extraction rate[%]. In Figures 16~19, the performance of the proposed method is represented by the point for each condition, while that of the existing method is represented by the curve. We evaluated the superiority of the proposed method by checking whether the point of the proposed method was above the curve of the existing method or not. As shown in Figures 16 and 17, only the point corresponding to "maxQ-JPEG75" was above the curve of the existing method for the results of all test images. Therefore the proposed method using "maxQ-JPEG75" was superior to the existing method for all test images in view of the robustness against JPEG compression of quality 75%. In comparison with each parameter of the proposed method, in the results of "balloon," "mandrill," and "parrots," the point corresponding to "maxQ-JPEG50" was located on the upper-left of "maxQ-JPEG75." The superiority of "maxQ-JPEG50" on the above cases would be decided depending on the importance of an extraction rate and a PSNR. As shown in Figures 18 and 19, the points corresponding to "maxQ-JPEG75" and "maxQ-JPEG50" were above the curve of the existing method for the results of all test images. Therefore the proposed method using "maxQ-JPEG75" or "maxQ-JPEG50" was superior to the existing method for all test images in view of the robustness against JPEG compression of quality 90%. Moreover the extraction rates of "maxQ-JPEG75" and "maxQ-JPEG50" for all test images were over 95%, where the errors could be recovered by using error correcting codes. In comparison with each parameter of the proposed method, the PSNRs of "maxQ-JPEG75" were higher than those of "maxQ-JPEG50" for all test images. From above discussion, the performance of "maxQ-JPEG75" was totally the best because of the imperceptibility shown in Figure 12 and the robustness against JPEG compression.

Watermarked images (JPEG75, maxQ).

Watermarked images (JPEG50, maxQ).

Comparison in the image quality.

Comparison in the image quality by enlarged partial regions.

Comparison in the robustness against JPEG compression of quality 75% (1).

Comparison in the robustness against JPEG compression of quality 75% (2).

Comparison in the robustness against JPEG compression of quality 90% (1).

Comparison in the robustness against JPEG compression of quality 90% (2).
6. Conclusion
We have proposed a watermarking method warranting the lower limit of the image quality of watermarked images. The proposed method warrants the lower limit of the image quality of watermarked images by introducing lower limit images and equalizes the degradation by embedding on watermarked images by using L a
a b
b color space. We have investigated the image quality of watermarked images, the validity of the lower limit images filtered by mathematical 2-dimensional human visual MTF model, the flexibility of the embedding strength, the performance using the maximum of
  of each block, the similarity between watermarked images and lower limit images, the robustness against JPEG compression, and the comparison with the existing method. Our future works should be to investigate the relationship between the robustness against general image processing and lower limit images and to improve the decision of the embedding strength for each block so as to improve the tradeoff of PSNR and an extraction rate.
References
Matsui K: Fundamentals of Digital Watermarking. Morikita Shuppan; 1998.
Yoshiura H, Echizen I: Maintaining picture quality and improving robustness of color watermarking by using human vision models. IEICE Transactions on Information and Systems 2006, E89-D(1):256-270. 10.1093/ietisy/e89-d.1.256
JIS handbook 61 Color 2007 Japanese Standards Association, 2007
Wikipedia : Lab color space. November 2009, http://en.wikipedia.org/wiki/Lab_color_space
Oyama T: Invitation to Visual Psycology. Saiensu-sha Co.; 2000.
Colors & Dyeing Club in Nagoya Osaka, November 2009, http://www005.upp.so-net.ne.jp/fumoto/
Ishihara T, Ohishi K, Tsumura N, Miyake Y: Dependence of directivity in spatial frequency responseof the human eye (1): measurement of modulation transfer function. Journal of the Society ofPhotographic Science and Technology of Japan 2002, 65(2):121-127.
Ishihara T, Ohishi K, Tsumura N, Miyake Y: Dependence of directivity in spatial frequency responseof the human eye (2): mathematical modeling of modulation transfer function. Journal of the Societyof Photographic Science and Technology of Japan 2002, 65(2):128-133.
Miyake Y, Ishihara T, Ohishi K, Tsumura N: Measurement and modeling of the two dimensionalMTF of human eye and its application for digital color reproduction. Proceedings of the 9th IS&T and SID Color Image Conference, 2001, Scottsdale, Ariz, USA 153-157.
Wang Z, Bovik AC, Sheikh HR, Simoncelli EP: Image quality assessment: from error visibility to structural similarity. IEEE Transactions on Image Processing 2004, 13(4):600-612. 10.1109/TIP.2003.819861
Author information
Authors and Affiliations
Corresponding author
Rights and permissions
Open Access This article is distributed under the terms of the Creative Commons Attribution 2.0 International License (https://creativecommons.org/licenses/by/2.0), which permits unrestricted use, distribution, and reproduction in any medium, provided the original work is properly cited.
About this article
Cite this article
Iwata, M., Kanaya, T., Shiozaki, A. et al. Digital Watermarking Method Warranting the Lower Limit of Image Quality of Watermarked Images. EURASIP J. Adv. Signal Process. 2010, 426085 (2010). https://doi.org/10.1155/2010/426085
Received:
Revised:
Accepted:
Published:
DOI: https://doi.org/10.1155/2010/426085