- Research
- Open access
- Published:
Text localization using standard deviation analysis of structure elements and support vector machines
EURASIP Journal on Advances in Signal Processing volume 2011, Article number: 47 (2011)
Abstract
A text localization technique is required to successfully exploit document images such as technical articles and letters. The proposed method detects and extracts text areas from document images. Initially a connected components analysis technique detects blocks of foreground objects. Then, a descriptor that consists of a set of suitable document structure elements is extracted from the blocks. This is achieved by incorporating an algorithm called Standard Deviation Analysis of Structure Elements (SDASE) which maximizes the separability between the blocks. Another feature of the SDASE is that its length adapts according to the requirements of the application. Finally, the descriptor of each block is used as input to a trained support vector machines that classify the block as text or not. The proposed technique is also capable of adjusting to the text structure of the documents. Experimental results on benchmarking databases demonstrate the effectiveness of the proposed method.
1 Introduction
The present electronic age produces vast quantities of many digital document images such as technical articles, business letters and faxes. In order to effectively exploit them by many systems, such as optical character recognition, Word Spotting [1, 2] and Document Retrieval Systems, the contained text must be located by a detection technique. The research community is engaged on an ongoing attempt to address this problem by using a variety of approaches. There are top-down techniques employing recursive algorithms to segment the whole page to small regions. The subdivision is based on a homogeneity criterion: the splitting procedure stops when the criterion is met, and blocks obtained at this stage constitute the final segmentation result [3]. The advantage of those methods is the high detection speed as they are not containing time-consuming operations, but they cannot handle documents well with very complex layouts. Some examples of top-down algorithms are reported in [4–7].
Bottom-up techniques first identify primary elements (e.g., characters) and afterwards merge them into larger regions (text blocks). The procedure can be iterated giving rise to a growing process which adjoins unconnected adjacent components to cluster higher-order components (such as words, lines, document zones). Strouthopoulos et al. [8] proposed such technique to automatically detect and extract text in mixed-type color documents using a combination of an adaptive color reduction technique and a page layout analysis approach. Jain et al. [9] presented a geometric layout analysis of technical journal pages using connected component extraction to efficiently implement page segmentation and region identification. Jiang et al. used a spatial color-quantized map, an edge map calculated by Sobel operators and morphology operators, in order to merge bounding boxes and obtained candidate text regions. In [10], a bottom-up technique first identifies marks using a suitable contour-following technique. A principal component analyzer is employed afterward to determine the principal axes of each mark, and a nearest-neighbor technique is used for finding the shortest distances between marks. A feature vector is formed based on mark dimensions and distances between them, which is then fed into a self-organizing feature map (SOFM) to divide the marks into homogeneous clusters. A set of fuzzy rules is formed using all cluster weights and variances. Finally, a fuzzy classification scheme identifies each mark as a character or a non-character. Recently, Li et al. [11] proposed an approach to automatically localize horizontally texts appearing in color and complex images. First, an edge-detection method using a wavelet transform is used to find text in an image. Afterward, the image is binarized, and a filter is applied for removing dispersed pixels and non-text area. Finally, a new projection profile is applied for estimating text regions. In [12, 13], the respective authors treated text detection as a classification problem. Li et al. [12] used support vector machines (SVM) to obtain a text region based on the features extracted by stroke filter calculation on stroke maps. Chen et al. [13] compared the SVM-based method with multilayer perceptrons (MLP) based on text verification over four independent features, namely, the distance map feature, the gray-scale spatial derivative feature, the constant gradient variance feature and the DCT coefficient feature. Finally they found that better detection results were obtained by using SVM rather than MLP. Bottom-up techniques can segment correct complex layouts but take considerably more time to complete than top-down methods.
Hybrid algorithms can be regarded as a mix of the previous approaches, thus configuring a procedure which involves both splitting and merging phases. In [14], authors proposed the adaptation of the Scale Invariant Feature Transform SIFT [15] approach in the context of text character localization in graphical documents. This method uses a combination of bottom-up and top-down approaches to separate and locate text characters. They extract knowledge from a bottom-up approach and use them in a top-down approach. Other hybrid algorithms are reported in [16–18].
Along with research in the text localization from still images, several algorithms have been proposed for text localization in videos. Video images often have complex backgrounds with strong edge or texture clutter, and it is very difficult to detect the graphic or scene text with high accuracy [19]. In [20], authors proposed a new localization and recognition method for scoreboard text in sport videos. The method first matches the SIFT points using a modified matching technique between two frames extracted from a video clip and then localizes the scoreboard by computing a robust estimate of the matched point cloud in a two-stage non-scoreboard filter process based on some domain rules. Some other text localization methods from videos are reported in [19, 21, 22].
This article proposes a new bottom-up method which detects and extracts homogeneous text in document images indifferent to font types and size by using connected components analysis for the object detection, document structure elements (DSE) to construct a descriptor and SVM to tag the appropriate objects as text. The proposed technique has the ability to adapt to the peculiarities of each document images database since the features are adjustable. It provides also the ability to increase or decrease text localization speed by the manipulation of the block descriptor length. A preliminary version of this work has been presented in [23].
Figure 1 depicts the overall structure of the proposed algorithm. After applying preprocessing techniques (median filtering and binarization), the initial blocks are identified using the connected component analysis (CCA) method. Then, these blocks are expanded and merged to model lines of text.

The steps of the proposed text-extraction algorithm.
Next, a descriptor that consists of a set of structural features (determined by a procedure called standard deviation analysis of structure elements--SDASE) is extracted from the merged blocks and used as input to a trained SVM. Finally, the output of the SVM defines the block as text or not.
The rest of the article is organized as follows: Section 2 describes the block detection method while Section 3 explains the creation of the block descriptor using a novel algorithm called SDASE. Section 4 presents the SVM and the algorithm to train them. Section 5 contains the evaluation and the experimental results of the text-extraction technique, and finally, the conclusions are drawn in Section 6.
2 Block detection using connected components labeling and filtering
The primary aim of the block detection method is to detect and extract all the objects of a document. This is accomplished using the connected components labeling and filtering technique.
First, a preprocessing step is applied to the document to prepare it for the block localization algorithm. This step consists of a median 5 × 5 filter for noise suppression, e.g., in case of badly maintained documents, and a binarization method (Figure 2b). The Median filtering is a nonlinear, signal-processing technique that is useful for noise suppression in images. The binarization is achieved by using the well-known Otsu [24] technique, which performs binarization through the histogram of the image by minimizing the inter-class variance between background and foreground pixels.

The block extraction steps. (a) the original document, (b) after the preprocessing, (c) the Connected Components, (d) the expanded Connected Components, (e) the final blocks after the merging of the Connected Components.
Next, all the objects of the document image are identified using the connected components labeling and filtering method proposed in [25] (see Figure 2c). These objects are called connected components (CCs). The steps to create the appropriate blocks for the next stage of the proposed method are:
-
Step 1: The very large and small CCs are disregarded to speed up the features extraction process (if there are such CCs). This is accomplished by the rejection of the CCs that satisfy one of the following conditions:
(1)where CC h the height of the CC and D h the document height.
-
Step 2: Create a CC height histogram as Figure 3a depicts.
Figure 3 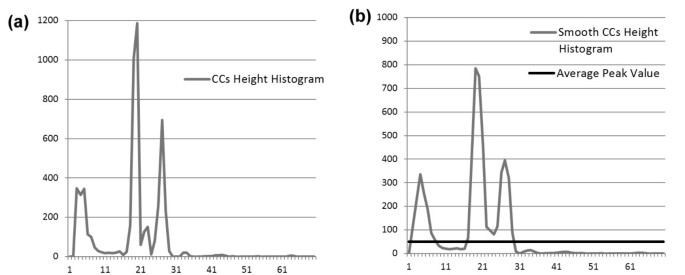
Calculation of the CC ch . (a) The height histogram of the CCs. (b) The smooth histogram and the average peak value. Here CC ch = 27.
-
Step 3: Apply a mean 3 × 1 filter to smooth the histogram (Figure 3b).
-
Step 4: Find the peaks H(p) of the histogram.
-
Step 5: Find the average of the each peak values:
(2)where Np is the total number of the peaks.
-
Step 6: Define as CC h the maximum height which the remaining peaks point to. For example, in Figure 3b, the CC h is equal to 27:
(3) -
Step 7: Expand the left and right sizes of the blocks by as Figure 2d illustrates.
-
Step 8. In [26], it has been proven that the height of a word can reach the double of a character mean size due to presence of ascenders and descenders. Hence, in the worst-case scenario where the CC h corresponds to a height of a character which does not have ascenders and descenders, it is safe to merge the overlapping CCs that satisfy the following conditions to model the line of texts (Figure 3e):
(4)where CC h1 and CC h2 are the heights of the two overlapping components.

3 Block description using SDASE
The next step involves the feature extraction stage of the blocks. The extracted features construct a descriptor of each block that maximizes the separability between the blocks. The spatial features are constructed by the number of the suitable DSE contained in each block.
Analytically, a DSE is any 3 × 3 binary block, as Figure 4 depicts. Therefore, it is obvious that there are total 29 = 512 DSEs. An integer L j is assign to each DSE such as (Figure 4a):

DSE Illustration. (a) The pixel order of the DSEs, (b) The DSE of L142.
For a block B, if C is the number of its columns and R the number of its rows then the block B contains (C - 2)(K - 2) DSEs. The initial descriptor of the block B is the histogram H(L j ) of the DSEs contained in that the block and it is calculated by the following equation:
for n = 1, 2, . . . , (C - 2)(K - 2) where L j , L v ∈ [1, 510]. Note that the 0 and 511 DSEs are removed because they correspond to pure background and pure document objects, respectively.
According to the above analysis a histogram is constructed by the following equation:
where X(L) is a vector of 510 elements.
Next, a feature-reduction algorithm is applied, which reduces the number of features. We call this algorithm SDASE.
If there are T text blocks and P non-text blocks, then the stages of the SDASE algorithm are:
-
1.
Find the standard deviation (SD) SDXT (L n ) of the X (L n ) for the T blocks for each L n DSEs.
-
2.
Repeat the same for the P blocks: Find the SD SDXP (L n ) of the X (L n ) for each L n DSEs.
-
3.
Normalize the SDXT (L n ) and SDXP (L n ):
(8)(9) -
4.
Then define the vector O (L n ) as
(10) -
5.
The first element/bin of the block descriptor corresponds to the L n DSE that has the maximum value of O (L n ). The second element/bin corresponds to the L n DSE that has the second largest value of O (L n ), and so on.
The aim of the SDASE is to find those DSEs that have maximum SD for the text blocks and minimum SD for the non-text blocks and the opposite. Hence, it sorts the DSEs by their ability to determine which block contains text or not. Also, the length of the descriptor can be reduced from the 510 initial DSEs to any number. We proposed the length of the descriptor to be around 128 as the evaluation suggests.
Note that the descriptor has the ability to adapt to the demands of each set of documents images. Also, if there is not enough computational power, the descriptor can decrease its size.
Section 5 presents experiments evaluating the effect of the descriptor length both on the proposed method speed and success rate. Obviously, a training dataset is required to determine the optimal DSEs. Fortunately, this does not cause a problem because such dataset already is required for the training of the SVMs.
Therefore, the final block descriptor is a 128 (or any other number that is chosen)-element vector, and it corresponds to the X (L n ) (Equation 7) of those 128 L n DSEs that the block contains. SVM is trained using this descriptor as input.
4 Block classification by SVM
The SVMs, introduced in 1992 [27, 28], are based on statistical learning theory and have been applied to many and various classification problems.
Let D be a given training dataset where x i is the i th input vector and y is the label correspond to the x i . The original linear SVM classifier satisfies the following conditions:
If the training data are not linearly separable (as in our case), then they are mapped from the input space X to a feature space F using the kernel method:
where φ (x) is the feature map. The kernel is transforming the input space to a high dimensional feature space where the training data become linearly separable. The most commonly used kernels are presented in Table 1. Our experiments showed that the Radial Basis Function is the most robust kernel.
If then the SVM conditions transform to
In practice, sometimes the classifier must misclassify some data points (for instance, to overcome the over-fitting problem). This is achieved using the slack variables ξ i > 0. Hence, Equation 12 is transformed to:
Finally, the maximum margin classifier is calculated by solving the following constrained optimization problem which is expressed in terms of variables α i :
The constant C > 0 defines the trade-off between the training error and the margin. The training data x i for which a i > 0, are called support vectors.
In SVMs, the function that decides the classification of the data to the two classes is
So, if f (x) > 0, then the data x are classified to class 1; otherwise, it is classified to class 0.
4.1 Parameter selection
One of the difficulties of the SVMs is the tuning of their parameters. In our case, there are two parameters: the C from the maximum margin classifier and the γ from the radial basis function kernel. The aim is to find the optimal values of the two parameters C and γ so that the classifier can accurately predict the unknown data. Very often, this is achieved through a cross-validation procedure by using a grid search for the two parameters. In this study, the parameter estimation algorithm (PEA) [29] from the parameter detection for the binarization methods is employed for the detection of the correct SVM parameters. The stages of the algorithm for the detection of the best SVM parameters values are
-
Stage 1: Set the initial range of the SVM parameter values. Consider the range [c s , c e ] for C and the range [γ s , γ e ] for γ. In this study, c s = 0, c e = 300, γ s = 0, and γ e = 40.
-
Stage 2: Set the number of steps executed in each iteration for each parameter. In this study, s c = 10 (C parameter) and s γ = 10 (γ parameter).
-
Stage 3: Calculate the lengths of each step according to the following equations:
(15)(16) -
Stage 4: Calculate all the values of parameters C and γ for each step according to the following equations:
(17)(18) -
Stage 5: Find the two pairs of parameter values that give the best and second-best results by cross-validation technique. Let (C1, γ1) and (C2, γ2) be those two pairs, respectively.
-
Stage 6: Redefine the ranges for the two parameters used during the next iteration according to the following equations:
-
Stage 7: Redefine the steps for the new ranges used in the next iteration according to the following equations:
(19)(20) -
Stage 8: if , or , then go to Stage 3 and repeat all the stages again with the new ranges and steps. If and , then terminate the procedure; the best parameter values are those calculated at Stage 6 of the last iteration.
The values of the SVM parameters obtained by the above procedure for the two databases (used for the evaluation of the proposed method) are presented in Table 2.
Finally, the SVM classifies each block as text or not and extract those blocks from the original image or locate them on it. Figure 5 shows some image document examples and the output of the proposed method.

Examples of the proposed method.
5 Evaluation
In order to evaluate the advantages of the PEA, the values of the SVMs parameters are detected also, with the cross-validation procedure by using a grid search. The results which are depicted at Table 3 show that the PEA detects the parameter values speedier and more precise than the grid search. To evaluate the proposed text localization technique an application is developed (available on-line from http://orpheus.ee.duth.gr/download/TextFinder1.2.14.zip) with the help of the Visual Studio 2008 and LIBSVM [30]. It is based on the Microsoft .NET Framework 3.5. The programming language that is used is the C#/XAML.
The application makes use of the Document Image Database from the University of Oulu [31, 32], which includes 233 types of documents. Those images contain a mixture of text and pictures.
As the classification by SVMs is based on the calculation of an ideal separating hyperplane between the two classes (text and non-text) by concentrating on the training samples that lies at the edge of the class and between the class centroids, all the other training samples are rejected [33]. Therefore, a high accuracy may be obtained with the use of a small training set [34]. Moreover, the SDASE descriptor of each block is formed with the widest possible separability between the two classes, so it is safe to assume that a very small training set is required. Figure 6 depicts that a training set beyond 5% of the total documents does not impact the success rate much. So, from the database ten images are selected to be employed as training samples for the SVMs and the SDASE algorithm. The first experiment evaluates the impact of the block descriptor length to the success rate of the proposed method.

The success rates of the proposed system with regard to the size of the training set (number of documents used as training samples).
Success Rate corresponds to the classification rate, meaning the percentage of which the classifier detects text and non-text blocks correct. It is defined as in the following equation:
The descriptor length X (L n ) is determined by the corresponding L n DSEs of the O (L n ) values of the SDASE algorithm output. The success rate of the proposed method is calculated starting using a descriptor with length equal to one and continuing to increase one by one to the maximum of 510. Figure 7a depicts the success rate in terms of the descriptor length to the training data, and Figure 7b depicts the same for the all documents that the database contains. The results show that after a descriptor length equal to 128 DSEs the success rate is not increased too much as the association between them is logarithmic.

The success rates of the proposed system with regard to the length of the block descriptor. (a) The success rate for the training data; (b) The success rate for all the database documents.
The next experiment estimates the correlation between the length of the descriptor and the computation time of the proposed method. We calculate the run time of the proposed method with regard to the descriptor length. Figure 8 portrays a linear correlation between them.

The computational time of the text blocks extraction from an image document.
Then, in order to appreciate the flexibility of the SDASE algorithm, noise is added to all the image documents of the Oulu Database and the O (L n ) is recalculated based on the new training dataset. Figure 9a, b depicts the success rate with regard to the descriptor length for the training data and for the whole image document database respectively. The results are similar to those from the original document images. Finally, Figure 10 illustrates some noisy document image examples and the output from the proposed method.

The success rates of the proposed system with regard to the length of the block descriptor for the noisy document image database. (a) The success rate for the training data; (b) The success rate for all the database documents.

Examples of our proposed method in the noisy documents.
Table 4 illustrates the comparison of the proposed text-extraction method against other methods from the literature. In [18], those authors employ sets of features which are likely to convey strong discriminatory information. The first set consists of a subset of 13 DSEs [35], which has been shown to be quite informative [36]. The second group of the texture features consists of 21 features, essentially pairs of neighboring DSEs, employed to resolve harder separation cases. Then, they performed a series of experiments, employing supervised (MLP and SVM), and unsupervised (SOFM) classifiers. The training samples and the image document database were the same we used for our experiments in this study. In addition to the above methods, the proposed method is tested against a hybrid approach [37] which it employs five Grey Level Co-occurrence Matrix features for each block. Each block is clustered by using pre-learned heuristics rules of a K-Means algorithm into three groups.
In order to emphasize the flexibility of the proposed SDASE algorithm, the previous comparison is employed on the noisy database. The results are presented in Table 5. The hybrid method takes the most hit because the pre-learned heuristic rules are not very well applied to noisy documents.
The previous two experiments show the ability of the proposed SDASE algorithm to adjust to the peculiarities of the database. Especially, the experiments on the noisy database make this fact more clear. Finally, the proposed text-extraction method scores better than other similar text-extraction techniques.
6 Conclusions
In this article, a bottom-up text localization technique is proposed that detects and extracts homogeneous text from document images. A CCA technique is applied which detects the objects of the document. Then a powerful and adaptive descriptor is constructed from the contained DSEs in each object based on the SDASE algorithm. Finally, a trained SVM classifies the objects as text and non-text.
In order to evaluate the proposed technique, we utilize the Document Image Database from the University of Oulu. First, we provide the correlation of the descriptor length with the success rate of the proposed method and we reach the conclusion that 128 elements is enough for the detection of the text blocks satisfactory. Moreover, the descriptor length can be increased or decreased accordingly to the computational constrains. In addition to that, we provide the run time of the proposed method with regard to the descriptor length. Then, we add noise to the Document Image Database and calculate the new block descriptor so as to demonstrate its flexibility. The results are very close to the original image documents. Finally, we assessed the efficiency of the SDASE text-extraction algorithm against other text-extraction techniques and it performed better.
References
Frinken V, Fischer A, Bunke H: A Novel Word Spotting Algorithm Using Bidirectional Long Short-Term Memory Neural Networks. In Artificial Neural Networks in Pattern Recognition: 4th IAPR TC3 Workshop, ANNPR 2010, Cairo, Egypt, April 11-13, 2010, Proceedings. Volume 5998. Springer; 2010:185.
Zagoris K, Papamarkos N, Chamzas C: Web Document Image Retrieval System Based on Word Spotting. ICIP 2006, 477-480.
Gorecki P, Caponetti L, Castiello C: Fuzzy Techniques for Text Localisation in Images.In Computational Intelligence in Multimedia Processing: Recent Advances, of Studies in Computational Intelligence Edited by: Hassanien AE, Abraham A, Kacprzyk J. Springer Berlin/Heidelberg; 2008, 96: 233-270. [http://dx.doi.org/10.1007/978-3-540-76827-210]
Matrakas MD, Bortolozzi F: Segmentation and Validation of Commercial Documents Logical Structure. ITCC 2000, 242-246.
Jun K: Neural network-based text localization in color images. "Pattern Recognition Letters 2001, 22: 1503-1515. 10.1016/S0167-8655(01)00096-4
Ingold R, Armangil D: A Top-Down Document Analysis Method for Logical Structure Recognition. First International Conference Document Analysis and Recognition 1991.
Ha J, Haralick R, Phillips I: Document Page Decomposition by the Bounding-Box Projection Technique. Third International Conference Document Analysis and Recognition 1995.
Strouthopoulos C, Papamarkos N, Atsalakis A: Text extraction in complex color documents. Pattern Recognition 2002,35(8):1743-1758. 10.1016/S0031-3203(01)00167-4
Jain AK, Yu B: Document Representation and Its Application to Page Decomposition. IEEE Trans Pattern Anal Mach Intell 1998,20(3):294-308. 10.1109/34.667886
Nikolaidis A, Strouthopoulos C: Robust text extraction in mixed-type binary documents. MMSP 2008, 393-398.
Aghajari G, Shanbehzadeh J, Sarrafzadeh A: A Text Localization Algorithm in Color Image via New Projection Profile. Proceedings of the International MultiConference of Engineers and Computer Scientists 2010.
Li X, Wang W, Jiang S, Huang Q, Gao W: Fast and effective text detection. ICIP 2008, 969-972.
Chen D, Odobez JM, Bourlard H: Text detection, recognition in images and video frames. Pattern Recognition 2004,37(3):595-608. 10.1016/j.patcog.2003.06.001
Roy PP, Pal U, Lladós J: Touching Text Character Localization in Graphical Documents Using SIFT. GREC 2009, 199-211.
Lowe DG: Distinctive Image Features from Scale-Invariant Keypoints. International Journal of Computer Vision 2004,60(2):91-110.
Jung C, Liu Q, Kim J: Accurate text localization in images based on SVM output scores. Image Vision Comput 2009,27(9):1295-1301. 10.1016/j.imavis.2008.11.012
Badekas E, Nikolaou NA, Papamarkos N: Text Localization and Binarization in Complex Color Documents. In MLDM Posters. Edited by: Perner P. IBaI publishing; 2007:1-15.
Emmanouilidis C, Batsalas C, Papamarkos N: Development and Evaluation of Text Localization Techniques Based on Structural Texture Features and Neural Classifiers. ICDAR, IEEE Computer Society 2009, 1270-1274.
Jung C, Liu Q, Kim J: A stroke filter and its application to text localization. Pattern Recognition Letters 2009,30(2):114-122. 10.1016/j.patrec.2008.05.014
Guo J, Gurrin C, Lao S, Foley C, Smeaton AF: Localization and Recognition of the Scoreboard in Sports Video Based on SIFT Point Matching. MMM (2) 2011, 337-347.
Su YM, Hsieh CH: A Novel Model-based Segmentation Approach to Extract Caption Contents on Sports Videos. ICME 2006, 1829-1832.
Hsieh CH, Huang CP, Hung MH: Detection and Recognition of Scoreboard for Baseball Videos. ICIC (1) 2008, 337-346.
Zagoris K, Papamarkos N: Text Extraction Using Document Structure Features And Support Vector Machines. Proceedings of the 11th IASTED International Conference on Computer Graphics and Imaging 2010.
Otsu N: A threshold selection method from gray-level histograms. IEEE Trans Sys, Man, Cyber 1979, 9: 62-66.
Suzuki K, Horiba I, Sugie N: Linear-time connected-component labeling based on sequential local operations. Computer Vision and Image Understanding 2003, 89: 1-23. 10.1016/S1077-3142(02)00030-9
Kavallieratou E, Fakotakis N, Kokkinakis G: Un Off-line Unconstrained Handwritting Recognition System. International Journal of Document Analysis and Recognition 2002, 4: 226-242. 10.1007/s100320200079
Boser BE, Guyon I, Vapnik V: A Training Algorithm for Optimal Margin Classifiers. COLT 1992, 144-152.
Cortes C, Vapnik V: Support vector networks. Machine Learning 1995, 20: 273-197.
Badekas E, Papamarkos N: Automatic Evaluation of Document Binarization Results.In Progress in Pattern Recognition, Image Analysis and Applications, of Lecture Notes in Computer Science Edited by: Sanfeliu A, Cortés M. Springer Berlin/Heidelberg; 2005, 3773: 1005-1014. [http://dx.doi.org/10.1007/11578079103] 10.1007/11578079_103
Chang CC, Lin CJ: LIBSVM: a library for support vector machines. Tech. rep., Taiwan University, Department of Computer Science and Information Engineering; 2010.
Sauvola J, Kauniskangas H: MediaTeam Document Database II, a CD-ROM collection of document images. Tech. rep., University of Oulu, Finland; 1999.
Sauvola JJ, Haapakoski S, Kauniskangas H, Seppänen T, Pietikäinen M, Doermann DS: A distributed management system for testing document image analysis algorithms. ICDAR 1997, 989-995.
Wang J, Neskovic P, Cooper L: Training Data Selection for Support Vector Machines.In Advances in Natural Computation, Volume of Lecture Notes in Computer Science Edited by: Wang L, Chen K, Ong Y. Springer Berlin/Heidelberg; 2005, 3610: 421-421. [http://dx.doi.org/10.1007/1153908771]
Foody G, Mathur A: Toward intelligent training of supervised image classifications: directing training data acquisition for SVM classification. Remote Sensing of Environment 2004,93(1-2):107-117. 10.1016/j.rse.2004.06.017
Strouthopoulos C, Papamarkos N: Text identification for document image analysis using a neural network. Image Vision Comput 1998,16(12-13):879-896. 10.1016/S0262-8856(98)00055-9
Nagy G, Set S: Hierarchical representation of optically scanned documents. Proc 7th Int Conference on Pattern Recognition 1984.
Lin M, Tapamo J, Ndovie B: A texture-based method for document segmentation and classification. South African Computer Journal 2006, 36: 49-56.
Author information
Authors and Affiliations
Corresponding author
Additional information
7 Competing interests
The authors declare that they have no competing interests.
Authors’ original submitted files for images
Below are the links to the authors’ original submitted files for images.
Rights and permissions
Open Access This article is distributed under the terms of the Creative Commons Attribution 2.0 International License (https://creativecommons.org/licenses/by/2.0), which permits unrestricted use, distribution, and reproduction in any medium, provided the original work is properly cited.
About this article
Cite this article
Zagoris, K., Chatzichristofis, S.A. & Papamarkos, N. Text localization using standard deviation analysis of structure elements and support vector machines. EURASIP J. Adv. Signal Process. 2011, 47 (2011). https://doi.org/10.1186/1687-6180-2011-47
Received:
Accepted:
Published:
DOI: https://doi.org/10.1186/1687-6180-2011-47