- Research
- Open access
- Published:
Comparison and analysis of point target reference spectrum of FMCW synthetic aperture imaging sensor
EURASIP Journal on Advances in Signal Processing volume 2012, Article number: 210 (2012)
Abstract
Frequency-modulated continuous-wave (FMCW) synthetic aperture imaging sensor (SAIS) combines FMCW technology and SAIS techniques which makes a lightweight, high-resolution, and cost-effective imaging sensor. FMCW SAIS systems are going to play an important role in airborne and spaceborne earth observation fields. However, the stop-and-go approximation used in conventional pulsed SAIR (e.g., synthetic aperture radar—SAR) is no longer valid due to the long signal duration time or low wave propagation speed. To exploit the potentialities of an accurate signal model under FMCW SAIS circumstances, this article presents the relationship and remarkable differences between the analytical FMCW SAIS point target reference spectrum model and the traditional ones in pulsed SAR and Synthetic Aperture Acoustic imaging system, and validates the significance of the additional range–azimuth coupling term and range walk term in FMCW SAIS spectrum introduced by the variation of slant range during the long pulse durations, and highlight the limitations of other two spectra. Finally, the simulation experiments are carried out to compare the performance of the aforementioned spectrum formulations.
Introduction
Frequency-modulated continuous-wave (FMCW) synthetic aperture imaging sensor (SAIS) combines FMCW technology and SAIS techniques which makes a lightweight, high-resolution, and cost-effective imaging sensor [1]. Different from conventional synthetic aperture radar (SAR) system which requires high peak transmission power [1–3], FMCW SAIS system operates on constant low transmission by extending the pulse duration without degrading either the resolution or SNR. This peak power reduction simplifies the transmitter design, increasing both performance and reliability as well as reducing the risk of breakdown or arcing in the high power cables [4]. FMCW SAIS has been developed with both acoustic source and electromagnetic wave in airborne remote sensing fields, such as reconnaissance, concealed target detection, robotic sensing, non-destructive testing, gas flow measurements, mine detection, surveillance, and so on [5]. The advantage of small size, light weight, and low peak power also makes FMCW SAIS possible to be developed for spaceborne remote sensing fields, like microsatellites. FMCW SAIS systems are going to play an important role in airborne and spaceborne earth observation fields.
The point target reference spectrum (PTRS) is an important basis to focus the SAIS signal in the frequency domain where the time-consuming superposition integrals in the space time domain is substituted by the fast convolution in the frequency domain [6, 7]. Thus, the processing efficiency can be highly improved. The focus of this article is to exploit the potentialities of an analytical spectrum model for FMCW SAIS system with both acoustic source and electromagnetic wave. Unlike conventional pulse SAR system, the signal PTRS model is based on the stop-and-go approximation, which assumes that the instantaneous slant range remains constant during the pulse duration time [6]. The analytical FMCW SAIS PTRS generally expresses FMCW SAIS signal by accurately addressing the variation of the instantaneous slant range during the pulse duration time [2]. This variation introduces a range-invariant range walk and a range–azimuth coupling term [2, 7] (range–azimuth coupling term is a spectrum phase term which is dependent on both range and azimuth frequency variables at the same time). In [5], the author developed a signal model under synthetic aperture acoustic (SAA) imaging system, where the invalidation of stop-and-go approximation is taken into account. It is assumed that the time from the transmitter to the reflector equals to half of the round-trip delay. In this article, we concentrate on the differences and relationship between the analytical FMCW SAIS PTRS model and the traditional ones, and validate the significance of the differences, in order to present a principle of choosing proper signal models in different configurations.
This article is organized as follows. In “Signal models” section, we compare the analytical FMCW SAIR PTRS with the conventional ones. “Validating method” section gives a way to validate the accuracy of the signal spectrum model. Simulation experiments are carried out in “Simulation experiment” section to show the significance of the special terms (i.e., the additional range–azimuth coupling term and range walk term) in FMCW SAIS PTRS by comparing with the other two models in SAA imaging systems, broadside FMCW SAR, and high-squint FMCW SAR circumstances. Finally, conclusions are reported.
Signal models
The general FMCW SAIS system geometry is investigated in this article, as shown in Figure 1.

FMCW SAIS system geometry.
The mathematical symbols and their definitions used in this article are given as follows.
Range and azimuth time variables
Range and azimuth frequency variables
Chirp rate
Slant range variable
Point target located at
Zero-Doppler time of the target
Shortest slant range from the target to the sensor
Backscattering coefficient of the point target
Wave propagation speed
Platform velocity
Carrier wavelength and carrier frequency of the transmitted signal
Reference range for dechirp-on-receive operation
The stop-and-go approximation is commonly used in conventional-pulsed SAR focusing algorithms, where the instantaneous slant range from the antenna to the target is assumed to remain constant during the pulse duration time. However, for FMCW imaging mode, in fact, the variation of instantaneous slant range during each pulse could not be neglected due to the long signal duration, thus the stop-and-go approximation used in conventional SAR PTRS is no longer valid.
By representing the accurate instantaneous slant range during the pulse duration time on the transmitted and received signal [2], the authors developed an analytical signal model for the FMCW SAR imaging system. As it is developed analytically without any approximation, it could be used as a general expression for FMCW SAIS system. The brief derivation is outlined as follows.
The accurate round-trip delay time for the wave propagation is formulated as [2]
where the Doppler factor is defined as
Considering the transmitted signal as , the echoed signal can be expressed as
Note that dechirp-on-receive operation is considered [2]. Based on the signal model, the analytical spectrum for SAIS was formulated as
where defined as
Using the stop-and-go approximation, the signal model in conventional pulse SAR system is achieved [6], which is formulated as
In [5], the author has considered the invalidation of stop-and-go approximation, but took an approximation that the time from the transmitter to the reflector equals to half of the round-trip delay time. Based on the assumption, an SAA signal PTRS model is developed, which is expressed as
Note that the dechirp-on-receive operation is also taken into account in formulating those spectra. Comparing the analytical spectrum of FMCW SAIS with the other two, some short remarks will be outlined to help understanding the relationship and differences of them.
-
1)
The main difference between the FMCW SAIS spectrum and the pulsed SAR spectrum is the square root of the previous one contains the additional range–azimuth coupling term , which is not presented in the pulsed SAR PTRS [2, 6]. The additional term of FMCW SAIS is introduced by the variation of the slant range during the long pulse duration, and results in the skewness of the 2D spectrum along the range frequency direction [2, 6]. In (7), the author also realized the inaccuracy of stop-and-go assumption and introduced a range–azimuth coupling term, but in a different expression from the analytical one as it is developed with approximation. This coupling term is the dominant difference between the aforementioned three spectrums.
-
2)
The term exists in both (4) and (7). It is a range-invariant range walk term, which is also caused by the variation of the slant range during the pulse duration.
-
3)
The three spectra share a common term , which is linearly dependent on the zero-Doppler time of the target. Thus, it determines the azimuth registration position of the target after azimuth compression.
-
4)
, , and are the last terms of the three spectrums, respectively. They are almost the same except for the second one which does not contain a Doppler factor . All of them are introduced by the dechirp-on-receive approach and refer to the constant range and azimuth shifts.
-
5)
The Doppler factor is generated by the relative motion between the platform and targets, which is always larger than 1. will significantly be large when the platform velocity and wave propagation speed are comparable, like SAA imaging circumstance.
We will validate the significance of the accurate FMCW SAR PTRS in “Simulation experiment” section and quest for if the other two spectrum formulations (6) and (7) can work under FMCW SAIS systems, i.e., SAA imaging system and FMCW radar system.
Validating method
The focusing simulations is mainly aimed at validating the significance of the special terms in FMCW SAIS spectrum and quest for if the other two spectrum models can work under certain circumstances. So, we do not practice complex signal focusing algorithms, instead, we just get the data focused by matched filtering operation in the 2D frequency domain. Thus, here we consider the case that the target region contains only one reflector as shown in Figure 2. According to the spectrum of FMCW SAIS expressed in (1), the matched filter is expressed as
where
where denotes the reference range for matched filtering. For the ongoing validation, we assume the window function of rectangular shape in both directions. Thus, the remaining signal after matched filtering operation is expressed as
where and represent the window function of rectangular shape in azimuth and range, respectively. After matched filtering the target at the reference range is fully focused [6].

Scene geometry with one point target.
Here, we define the reference slant range as the closest range from the target to the antenna, i.e.,
Substituting on the right-hand side of (8) yields
Perform 2D inverse Fourier transform on the signal to transform it into the complex image domain [7]. We obtain
where and are the sinc-like compressed pulse envelope in the range and azimuth, respectively.
From (11), we can see that for the only target we consider at , the signal is perfectly focused when we define the reference slant range as the closest range from the target to the antenna. That is to say, if the spectrum represents the characteristic of FMCW SAIS well, the target at the reference range will be well focused, otherwise, it will be de-focused.
In the next section, we will highlight the significance of the range–azimuth coupling term and range walk term introduced by the variation of the slant range during the long pulse duration, by showing the different simulation results based on the different PTRS models.
Simulation experiment
Airborne simulations will be carried out in this section to validate the performance of FMCW SAIS spectrum model in both SAA imaging configuration and FMCW radar systems, respectively. We will also show the significance of the additional range–azimuth coupling term and range walk term, by calculating the phase error of the signal model in (4) and (5), and show the different simulation results based on the different spectrum models.
SAA imaging system
First, we consider a continuous acoustic imaging sensor. The designed scene consists of one point target in the scene center perpendicular to the flight direction, as shown in Figure 2. The parameters of the designed system are shown in Table 1.
To highlight the effort of the additional range–azimuth coupling term and range walk term, and compare the accuracy of the aforementioned PTRS models, different matched filters are used in the following experiments. To quantify the precision of processing, the impulse response width (IRW), peak sidelobe ratio (PSLR), and integrated sidelobe ratio (ISLR) are used as criteria. For the ongoing simulations, we assume the window function of rectangular shape in both directions. It is noted that the theoretical IRWs are determined by the system configuration, which is 0.2 m in azimuth and 0.17 m in range. The theoretical PSLR is −13.26 dB and the ISLR is −9.76 dB.
-
(1)
The first filtering function is based on the FMCW SAIS PTRS (6), i.e., , which is formulated based on the analytical development without any approximation. This is the most accurate formulation for FMCW SAIS. The processing result based on the FMCW SAIS PTRS is shown in Figure 3a. To show the focusing performance in more details, the contour of the target amplitude is shown in Figure 3b. The measured parameters of the focused target listed in Table 2 agree well with the theoretical values, which means that the proposed SAIS PTRS model gets the target well focused.
-
(2)
The second simulation experiment is based on the traditional SAR signal PTRS model, which is developed under stop-and-go approximation. According to (4), the matched filter based on conventional SAR model is formulated as
(14)The focused result using the conventional SAR matched filter (12) is shown in Figure 3c. The contour of the focused result is shown in Figure 3d for more details. Parameters of the focused target are listed in Table 2, which greatly deviate from the theoretical values. Obviously applying does not achieve satisfactory focusing result. This could be explained by the phase error term of SAR spectrum model , i.e.,
(15)Based on the system parameters shown in Table 1, the phase error term (13) is shown in Figure 4a. The phase error is unacceptable as it is much greater than the acceptable level . It is obvious that the conventional SAR signal model is not suitable for SAA imaging configuration. The stop-and-go assumption is no long valid in SAIS configuration with acoustic source.
Figure 4 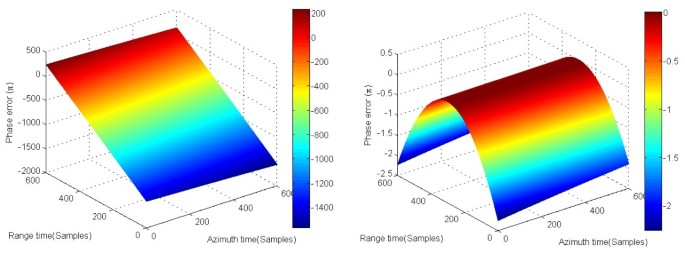
(a) The phase error of the SAR spectrum model in acoustic imaging configuration. (b) The phase error of the SAA spectrum model in acoustic imaging configuration.
-
(3)
The third simulation experiment considers about the SAA signal model (5), where it is assumed that the time from the transmitter to the reflector equals to half of the round-trip delay, thus the matched filter is formulated as
(16)


Focused target in acoustic imaging configuration: (a) based on the proposed SAIS PTRS; (b) the contour energy of (a) ; (c) based on the conventional SAR PTRS; (d) the contour energy of (c) ; (e) based on the SAA PTRS; (f) the contour energy of (e).
The focused result using the SAA matched filter (14) is shown in Figure 3e. The contour of the focused result is shown in Figure 3f for more detail. Parameters of the focused target are listed in Table 2, which also deviate from the theoretical values.
Comparing these results shows that the focusing performance of SAA filtering function is much better than that of the conventional SAR, but still worse than the accurate FMCW SAIS. We refer to the phase error of the SAA spectrum model , which is expressed as
Figure 4b presents the phase error (15), which is not only much smaller than that of the conventional SAR model, but also greater than the acceptable level of , proving that the SAA system signal model also do not express the signal of SAA imaging system well enough.
The simulation experiments proved the accuracy of the analytical FMCW SAIS in SAA imaging configuration, where the assumptions in traditional pulse SAR signal model seriously degrade the focusing performance, and the assumption in developing SAA model is not accurate enough.
FMCW radar imaging
The second series of experiments are aimed at validating the performance of the spectra in FMCW radar systems. The designed scene consists of one point target in the scene center, as shown in Figure 2. The simulation system is designed following the parameters shown in Table 3.
Case 1: broadside configuration
We design a broadside FMCW radar system following the parameters in Table 3, where the target is orthogonal to the flight direction. The theoretical resolutions are all 0.3 m in both range and azimuth directions. We also perform the three formulations of matched filtering function in the 2D frequency domain, i.e., , , and .
Figure 5a shows the focused target based on FMCW SAIS spectrum model, and the contour of the amplitude of the focused target is exhibited in Figure 5b. The 2D measured parameters are shown in Table 4, and agree well with the theoretical values. This means that the SAIS signal PTRS also fits well in broadside FMCW radar circumstance.

Focused target in FMCW radar imaging configuration: (a) based on the proposed SAIS PTRS; (b) the contour energy of (a) ; (c) based on the conventional SAR PTRS; (d) the contour energy of (c) ; (e) based on the SAA PTRS; (f) the contour energy of (e).
Figure 5c shows the simulation result using the matched filter based on traditional SAR signal model, and Figure 5d shows its contour response. Table 4 shows its 2D measured parameters, which are far from the theoretical values.
Comparing Figure 5d with Figure 5b, we can see that for broadside FMCW SAR, the performance of the traditional SAR matched filter does not achieve results with satisfaction. The phase error term is formulated as (13), Figure 6 shows how it behaves under broadside FMCW SAR circumstance, which is unacceptable as it is much greater than the acceptable level . The value of phase error also indicates the failure of traditional pulse SAR PTRS in describing the signal spectrum in broadside FMCW radar configuration.

(a) The phase error of the SAR spectrum model in broadside FMCW radar imaging configuration. (b) The phase error of the SAA spectrum model in broadside FMCW radar imaging configuration.
Then, we apply the match filtering operation based on in broadside FMCW configuration, and exhibit the simulation results in Figure 5e,f. The 2D measured parameters are listed in Table 4. The focusing performance does not show obvious difference from the result achieved by FMCW SAIS filtering, and the calculated parameters agree with the theoretical ones. The phase error expressed in (15) is presented in Figure 6, which is too small to affect the focusing performance.
From the simulation experiments above we note that the assumptions in traditional pulse SAR signal model causes great errors, but the assumption in developing SAA signal model is acceptable in broadside FMCW radar configuration.
Case 2: high-squint configuration
A high-squint FMCW radar system is designed using the parameters in Table 3. In this article, the system is designed with an ultra high-squint angle of 60°, when the maximal phase error of SAA spectrum model almost reaches , as shown in Figure 7b. In this configuration, the theoretical resolution is 0.6 m in azimuth and 0.3 m in range.

(a) The phase error of the SAR spectrum model in FMCW radar imaging configuration with a squint angle of 60°. (b) The phase error of the SAA spectrum model in FMCW radar imaging configuration with a squint angle of 60°.
Perform the three formulations of matched filter, as presented in (6), (12), and (14), respectively. Figure 8a shows the focused target based on the FMCW SAIS spectrum and the contour response of the focused target is shown in Figure 8b. The parameters are listed in Table 5. The simulation results prove that the proposed FMCW SAIS PTRS achieves well performance in FMCW radar system with a squint angle as high as 60°.

Focused target in FMCW radar imaging configuration with a high-squint angle of 60°:(a) based on the proposed SAIS PTRS; (b) the contour energy of (a) ; (c) based on the conventional SAR PTRS; (d) the contour energy of (c) ; (e) based on the SAA PTRS; (f) the contour energy of (e).
Then, we verify the performance of conventional PTRS in high-squint FMCW radar system, and show the focused target in Figure 8c and its contour in Figure 8d, respectively. Figure 8d,e shows the focusing performance by applying the SAA-matched filtering function in FMCW radar system with a 60° squint angle. Measured parameters of the focused targets are shown in Table 5 for reference.
The focusing results show the failure of both conventional pulse SAR PTRS model and SAA signal PTRS model in characterizing high-squint FMCW radar signal spectrum, which could be forecasted by the value of phase error.
The simulation experiments show that the additional range–azimuth coupling components play an important role in high-squint FMCW radar cases. Neglecting the variation of the slant range during the long pulse duration will result in a significant degradation in the focusing performance.
Conclusion
In this article, we validated the significance of the additional range–azimuth coupling term and range walk term in FMCW SAIS PTRS introduced by the variation of slant range during the long pulse durations, and proved the failure of the other two spectrum models in pulsed SAR and SAA imaging system under acoustic imaging system in FMCW configuration and high-squint angle FMCW radar imaging system. Simulation experiments are carried out concerning the acoustic source FMCW SAIS, the broadside FMCW radar, and high-squint FMCW radar cases. It needs to emphasize that the previous algorithms in [8–10] perform well in the broadside FMCW radar case but fail in acoustic imaging and high-squint FMCW radar cases.
Simulation experiments are carried out to validate the performances of different signal models and to analyze the accuracy of them. The analytical signal model works well under all of the aforementioned conditions, proving its capability as a general expression for FMCW SAIS systems with both acoustic source and electromagnetic wave. Simulation results show that the additional range–azimuth coupling components and range walk term play an important role under acoustic imaging and high-squint FMCW radar cases. Neglecting the range–azimuth coupling phase terms will result in a significant degradation in focusing performance.
References
Meta A, Hoogeboom P, Ligthart LP: Signal processing for FMCW SAR. IEEE Trans. Geosci. Remote Sens 2007, 45(11):3519-3532.
Wang R, Loffeld O, Nies H, Knedlik S, Hägelen M, Essen H: Focus FMCW SAR data using the wavenumber domain algorithm. IEEE Trans Geosci Remote Sens 2010, 48(4):2109-2108.
Charvat GL, Kempel LC: Synthetic aperture radar imaging using a unique approach to frequency-modulated continuous-wave radar design. IEEE Antennas Propagat Mag 2006, 48(1):171-177.
Curlander C, Mcdonough RN: Synthetic Aperture Radar: Systems and Signal Processing. Wiley, New York; 1991.
Soumekh M: Airborne synthetic aperture acoustic imaging. IEEE Trans Image Process 1997, 6(11):1545-1554. 10.1109/83.641414
Wang R, Loffeld O, Neo YL, Nies H, Dai Z: Extending Loffeld’s Bistatic formula for general bistatic SAR configurations. IET Radar Sonar Navigat. 2010, 4(1):74-84. 10.1049/iet-rsn.2009.0099
Cumming IG, Wong FH: Digital Processing of Synthetic Aperture Radar Data Algorithms and Implementation (Artech House. Norwood, MA; 2005.
De Wit JJM, Meta A, Hoogeboom P: Modified range-Doppler processing for FM-CW synthetic aperture radar. IEEE Geosci Remote Sens Lett 2006, 3(1):83-87. 10.1109/LGRS.2005.856700
Meta A, Hoogeboom P, Ligthart LP: Non-linear frequency scaling algorithm for FMCW SAR data. Proc. EuRAD, Manchester, UK; 2006:9-12. September
Jiang ZH, Kan HF, Wan JW: A chirp transform algorithm for processing squint mode FMCW SAR data. IEEE Geosci Remote Sens Lett 2006, 4(3):377-381.
Acknowledgment
This work reported herein was jointly supported by the Hundred Talents Program of The Chinese Academy of Sciences and the General Program of National Natural Science Foundation of China under Grant 61172122.
Author information
Authors and Affiliations
Corresponding author
Additional information
Competing interests
The authors declare that they have no competing interests.
Authors’ original submitted files for images
Below are the links to the authors’ original submitted files for images.
Rights and permissions
Open Access This article is distributed under the terms of the Creative Commons Attribution 2.0 International License ( https://creativecommons.org/licenses/by/2.0 ), which permits unrestricted use, distribution, and reproduction in any medium, provided the original work is properly cited.
About this article
Cite this article
Liu, Y., Deng, YK., Wang, R. et al. Comparison and analysis of point target reference spectrum of FMCW synthetic aperture imaging sensor. EURASIP J. Adv. Signal Process. 2012, 210 (2012). https://doi.org/10.1186/1687-6180-2012-210
Received:
Accepted:
Published:
DOI: https://doi.org/10.1186/1687-6180-2012-210