- Research
- Open access
- Published:
GPS-R L1 interference signal processing for soil moisture estimation: an experimental study
EURASIP Journal on Advances in Signal Processing volume 2014, Article number: 107 (2014)
Abstract
Global positioning system reflectometry (GPS-R) is an emerging area of GPS applications in microwave remote sensing using multipath reflected signals. Soil moisture estimation is one of the many potential applications of the GPS-R technique. The focus of this study is on investigating the feasibility of soil moisture estimation based on GPS L1 band interference signals which can be readily captured using a low-cost off-the-shelf L1-band GPS receiver. The theoretical background is studied, and the field experiments conducted are described. Power spectrum analysis is performed on the received interference signals to determine the interference signal frequency variation, and cosine similarity is applied to identify the initial phase change. Data collected at a number of continuously operating GPS stations are also analyzed. The results demonstrate that both interference signal frequency and phase have changed significantly after rainfalls occurred. That is, it is possible to estimate soil moisture by analyzing the frequency change and phase shift. However, it is also observed that the phase shift is inconsistent in some cases. Ongoing work will focus on figuring out the source of the inconsistency so that reliable estimation of soil moisture can be achieved.
1 Introduction
In recent years, soil moisture estimation using global positioning system reflectometry (GPS-R) technology has drawn significant attention from the scientific community [1, 2]. GPS-R is a typical bi-static radar technology with transmitters located on GPS satellites and receivers mounted on a LEO satellite, an aircraft, or a structure on the ground. Two main methods have been investigated by researchers, and the first method uses normalized power. Masters et al. collected GPS-reflected signals using a delay-mapping receiver on board an aircraft to investigate the relationship between the mean reflection power and soil moisture [3] Zavorotny et al conducted a tower-based experiment by placing a modified GPS receiver on the NOAA Boulder Atmospheric Observatory tower to receive direct and reflected signals for a study of the polarization sensitive factor [4]. During the period from 2002 to 2005, the University of Colorado and National Center for Atmospheric Research (NCAR, USA) conducted several airborne GPS reflection experiments for soil moisture estimation [5].
The other method is interference technology, which uses the interference between the direct signal and the signal reflected from the ground surface. A number of experiments have been carried out for such an investigation [6, 7]. An electrodynamics model for GPS direct and reflected signal interference has been developed by Zavorotny et al. [8]. The data collected by the EarthScope Plate Boundary Observatory (PBO) network stations were used by a number of researchers to estimate soil moisture by power spectrum analysis method and in situ soil moisture measurement was used as the ground truth [9, 10]. However, due to the complexity of soil components and GPS multipath environment (e.g., surface roughness and vegetation), more experiments are needed to investigate the relationship between the soil moisture and interference signals.
The main contribution of this paper is the proposed method of soil moisture estimation using a low-cost GPS L1 receiver, a horizontally polarized antenna, and power spectrum analysis. The proposed method is extensively evaluated with data recently recorded during a number of ground-based experiments in Melbourne, Australia, and Wuhan, China. The experimental results are validated using in situ soil moisture measured by a moisture meter. One of the main existing methods is based on determining the Brewster angle using data recorded via a vertically polarized antenna. However, it may not be suitable to apply power spectrum analysis to vertically polarized signal due to spectrum line splitting and peak frequency shifting. In the existing power spectrum analysis-based methods, data is recorded by zenith-looking right-hand circular polarized (RHCP) GPS L1/L2 dual frequency antennas as well as an expensive geodetic-quality GPS L1/L2 receiver which has increased resistance to jamming and the ability to measure and remove the ionospheric delay error. Therefore, the proposed method is significantly different from the existing methods.
The remainder of the paper is organized as follows. Section 2 introduces the principle and methodology of using GPS L1 interference signal to determine soil moisture. Section 3 describes the GPS-R experiments conducted by a commercial low-cost GPS receiver. Section 4 shows some results from processing data obtained at a continuously operating GPS site, and the final section gives discussions and conclusions.
2 Principle and methodology
2.1 Hardware components
Figure 1 shows the key components of the GPS-R testing system and the geometry configuration in the experiments. The essential difference between our testing system and a standard GPS receiver is that a horizontally polarized antenna instead of a RHCP antenna towards the zenith is employed in the reflectometry system. One reason for not using the zenith-pointing RHCP antenna is that the zenith-pointing antenna is optimized to receive the direct signal and suppress the reflected signal from the soil surface. The other reason is that it receives RHCP signal which has both horizontal component and vertical component. As pointed out by Alonso-Arroyo et al. [11], the reflection coefficient phase of the horizontal component is very close to 180°; it does not vary with the elevation angle or the soil moisture content. But the reflection coefficient phase of the vertical component is affected by the soil moisture content significantly. Such a phase difference has been employed to improve the determination of the Brewster angle and hence the soil moisture estimation accuracy (see Alonso-Arroyo et al. [11]).

The key components of the GPS-R system and their geometry configuration.
The horizontally polarized antenna can receive both direct and reflected signals with nearly the same gain and hence the interference effect between the direct and reflected signals can be maximized which will benefit the data processing process as described later in Section 3.2. In addition, it improves the quality of spectrum analysis, as shown later in Section 4.1.
GPS receiver module is a basic component for signal acquisition. Many commercial GPS receiver modules have the features of high performance, low-cost, and small size. For example, the LEA-4 T [12] used in our experiments is a GPS module featuring u-blox receiver technology in which the u-blox binary RXM-RAW message is collected at a rate of 1 Hz and the SNR information is collected using the u-Center software. The u-Center software outputs data of satellite PRN, elevation, and azimuth angle of GPS satellites, which are used for the estimation of soil moisture.
2.2 Reflected signal and interference signal
Two major parameters are influenced by soil moisture when the GPS signals are reflected, i.e., the amplitude and the excess phase of the reflected signal. The amplitude of the reflected signals depends on several factors. The first factor reflects the geometric characteristics of the surface, such as surface roughness. The second factor is related to the electromagnetic characteristics of the surface, such as the electrical permittivity and the magnetic permeability of surface soil. The third factor is to do with the parameters of the radar system, such as the system frequency, the polarization of transmitting and receiving antennas and the elevation of the satellite. These parameters make the estimation process of soil moisture from the amplitude or power of the reflected signals complicated.
To simplify the analytical model, a flat field is chosen in our experiments for an approximation of a smooth surface. The areas with short sparse grass cover or bare soil are assumed to be a single player. The reflection coefficients Γ V (vertically polarized) and Γ h (horizontally polarized) of the surface are given by the following Fresnel's equations:
where, ϵ1 and ϵ2 are the dielectric constants of air and soil respectively; γ is the elevation angle of the GPS satellite of interest.
The excess phase arises when the reflected signals are delayed in time with respect to the direct (line-of-sight) signals. In fact, when the L-band GNSS signals impinge upon the ground surface, in addition to that some of the energy is reflected by the surface, they also penetrate into soil and are reflected by deeper layers. Generally speaking, two types of depth are involved. One is the penetration depth, which is defined as the depth below the surface at which 1/e of the surface power density of a perpendicularly incident wave remains in a half-space of the material at a specified frequency. The other type of depth is the ‘moisture sensing depth’ which is defined as the effective reflection depth of approximately one-tenth of a wavelength in the medium for passive microwave remote sensing. Though the ‘moisture sensing depth’ is difficult to validate experimentally, it is consistent with experimental results [13]. Here, Δh is used to represent the sensing depth, as shown in Figure 1.
The reflected signal v r , combined with the direct signal v d in the receiver, forms the interference signal vinf, which can be expressed as:
In (2), the v d value depends on the signal-to-noise ratio (SNR) of the direct signal and is influenced by the antenna model with a slowly varying trend. The reflection coefficient Γ h and the phase φ = 4π(h + Δh)sin γ/λ are related to the antenna height (h), the effective remote sensing depth Δh (which relates to the soil moisture mv), and elevation angle γ. The amplitude of the interference signal vinf will show a dominant oscillation with a frequency of 2 h/λ when it is plotted as a sine function of an elevation angle [8] and the interference signal has an excess phase of 4πΔh/λ after the direct signal trend is subtracted. Then, frequency values can be observed from periodograms, and excess phases can be estimated by phase matching as described later in Section 3.2.
3 Horizontal polarization antenna experiment
3.1 Experiment description
A number of field experiments were carried out in an open area of Gardiners Creek in Melbourne, Australia, in May 2013. The soil can be classified as Brown Chromosol according to the literature [14], and the key profile properties of the soil in our experiments, including electrical conductivity (EC) and water, are shown in Figure 2. The profile has nearly uniform moisture and EC throughout a 20-cm surface domain. As shown in Figure 3, two receivers and two horizontal polarized antennas were oriented towards east with different heights (H1 ≈ 1 m, H2 ≈ 1.1 m) for collection of data of interference signals. During the experiment period, the ground temperature was recorded to be 10° to 20° and a soil moisture meter (PMS-714) [15] with a two-wire type probe was used to collect in situ moisture measurements for comparison and validation of our GPS-R testing results. The soil moisture is measured by simply inserting the probe into the soil to a depth of about 2 cm. Since the soil volume measured with the time domain reflectometry equipment may be approximated to be a cylinder whose diameter in vertical dimension is approximately 1.4 times the inter-wire distance (1 cm for PMS-714) in the probe [16], this soil moisture equipment measures the moisture content in a shallow near-face region.Figure 3a shows two GPS-R antennas attached on a tripod, while the experimental site is shown in Figure 3b. The colored ellipses in Figure 3b are the footprints (first Fresnel zones) of the satellites of concern. The surrounding trees (less than 5 m in height) are far away from the antenna (more than 150 m), so they are out of the coverage of the GPS footprints when the elevation angles of satellites are from 5° to 30°.

The key profile properties in Melbourne experiments.

Antennas and the experimental site. (a) GPS-R antennas attached to a tripod. (b) Experimental site in Gardiners Creek, Melbourne, Australia.
As shown in Figure 3, GPS-R estimation results are in fact for an area rather than a point, while soil moisture measurements from a meter are from single points. To perform a fair comparison so as to validate the GPS-R performance, the area around the antenna was divided into 20 grids with each grid size of 1 m × 1 m and the moisture in every grid (regarded as a point) was measured by the meter, and the average of these 20 measurements is treated as the ground truth. The experiments were conducted for 2 days; one was before rainfall and the other was after rainfall. The in situ measurement results are shown in Table 1. The mean soil moisture of the 20 grids/points before rainfall is 9.3% and after rainfall is 15.1%.
3.2 GPS-R data processing
The reflected and direct signals are received and processed by the baseband processor to obtain information including the Universal Time Coordinated (UTC), SNR, and elevation and azimuth angle. They are then utilized to aid data processing to estimate soil moisture in the procedure as follows:
-
1.
Obtain the SNR data from elevation angles of 5° to 30°, filter the data by a filter to mitigate high frequency noise, convert decibel (dB) into amplitude (voltage), and then rearrange the amplitude as a sine function of the elevation angle.
In our experiments, there is no apparent trend in the SNRs since the horizontal polarized antenna amplifies the interference effect and reduces the influence of the antenna pattern. However, to suppress high-frequency noise, a smoothing filter is applied, which uses a 20-point (epoch) moving average filter to generate a series of averages of different subsets of the full data set.Figure 4a shows the received SNRs of satellite G1, G7, G8, G11, G17, and G28 before rainfall. All the SNR values fluctuate between 20 and 55 dB. Figure 4b depicts the rearranged amplitude of these data according to the sine of elevation angles after the filter is used. It can be observed that these SNR time series are not a periodic function of time with a specific frequency, since the frequency is a time-varying variable:
Figure 4 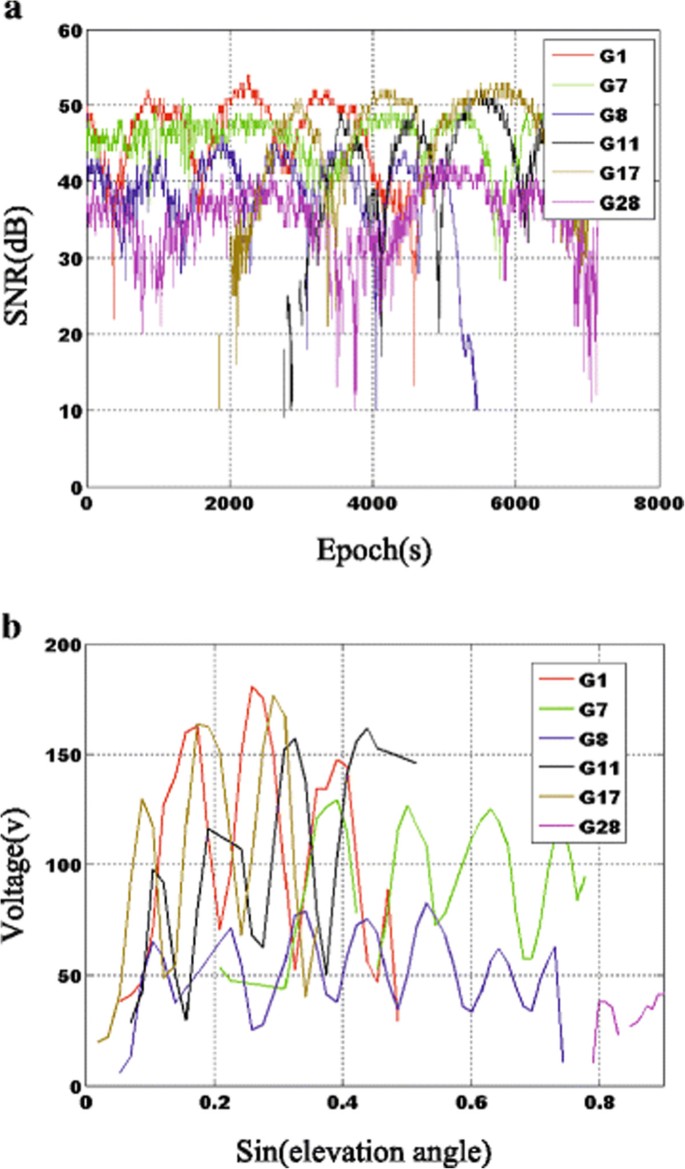
SNR value and amplitude. (a) Received SNR value before rainfall associated with satellites G1, G7, G8, G11, G17 and G28. (b) Amplitude in terms of voltage vs. sine of elevation angle of satellites G1, G7, G8, G11, G17, and G28.
(3)where sin γ is a time-varying variable and h and λ must use the same unit. On the other hand, the SNR is a periodic function of variable sin γ. Differentiating the interference signal phase with respect to variable sin γ yields
(4)That is, the SNR is a periodic function of variable sin γ with a frequency of 2 h/λ. Since sin γ is a dimensionless variable, the period and frequency of the SNR function in terms of sin γ is also dimensionless, which is in accordance with the expression of 2 h/λ. However, for convenience of processing and analysis, sin γ may be simply treated as a time variable and the unit of the horizontal axis in Figure 4b is second. That is, the time variable ranges between 0 and 1 s, and the SNR is a periodic function of ‘time’ with a frequency equal to 2 h/λ Hz.
The four satellites G1, G8, G11 and G17 can be employed to estimate soil moisture since they have enough data samples with values in the range of 0 to 0.5 in the horizontal axis, while the other two satellites, i.e. G7 and G28, have values most in the range of 0.5 to 0.9, which means they are from high elevation angle satellites and hence not suitable for soil moisture estimation.
-
2.
Carry out power spectrum analysis of the amplitude data to identify the signal with a frequency of 2 h/λ. Since the horizontal axis is the sine of elevation, the data are unevenly sampled and a least-squares spectral analysis is performed. Here, we use the Lomb-Scargle method [17], which computes the periodogram of a sequence of unevenly spaced samples. Note the SNR time series of the interference signal.
-
3.
Obtain interference signal v inf and attenuate those noise frequency components by a band-pass filter which has the following characteristics: the center frequency is 2 h/λ and the bandwidth is 3 Hz. This filter is a zero phase filter [18] so that accurate phase information caused by soil moisture can be retained. The filter is acquired by a forward-backward Butterworth filtering process with no phase distortion.
-
4.
Identify the phase ϕ inf of the interference signal v inf using the matching method, i.e., generate a series of signals from the model v i = sin(2πt · 2 h/λ − ϕ i ) with a frequency of 2 h/λ and discrete initial phases ϕ i = 10 × i, i = −18, −17,⋯, +17 (from −180° to +170° with a step of 10°), then calculate the cosine similarity between the model data v i and v inf by cos(θ) = (v inf · v i )/(‖v inf‖‖v i ‖). The resulting similarity range is from −1 to 1, meaning from exactly the opposite to exactly the same. For an interference signal, when ϕ i = ϕ inf, the cosine similarity will be the maximum.
-
5.
Analyze the relationship among the parameters of the identified frequency 2 h/λ, the matched phase ϕ inf, and soil moisture.

3.3 Experiment results
Two sets of data were recorded at the same time by two identical receivers before and after the rainfall. Two identical antennas are connected to the two receivers, respectively, but they have different heights above the ground.
3.3.1 Comparison of received signals from two antennas before rainfall
Figure 5a,b,c,d shows the Lomb-Scargle periodograms (left panel) and the cosine similarities (right panel) of the SNR time series from satellites G1, G8, G11, and G17 received by the higher antenna (solid line) and lower antenna (dash line) before the rainfall, respectively. In the left panel, the frequencies of the interference signals (dominant frequencies, i.e., the highest peaks) decrease by about 2 Hz (i.e., 20%) when the antenna height decreases from H2 to H1. The powers of the interference signal received by the higher antenna are slightly smaller. As for the phase match in the right panel (a, b, d), the results show that when the main frequencies of the interference signals decrease, their initial phases increase. But (c) is an exception, in which both frequency and initial phase increase.

The Lomb-Scargle periodograms and the phase matching results of satellites. G1 (a), G8 (b), G11 (c), and G17 (d) from antennas of H1 and H2.
Figure 5 demonstrates that the height of antenna above the reflecting surface has significant influence on the frequency and phase of GPS L1 interference signals. In the left panel of Figure 5, although a band-pass filter with central frequency 2 h/λ and bandwidth 3 Hz is applied, there exist undesired signals with frequencies lower than 5 Hz, which need to be further filtered for phase match.
3.3.2 Comparison of received signals from higher antenna before and after rainfall
Figure 6 shows the periodograms of the SNR time series received by the higher antenna (H2 ≈ 1.1 m) before (solid line) and after (dash line) the rainfall. Both the frequency and initial phase of the interference signals change after the rainfall. The left figures indicate that the frequencies of the interference signals decrease after the rainfall, meaning the decrease in moisture sensing depth. The right figures show that after the rainfall, the initial phase step of the interference signal increases from 21 to 26 in (a), 20 to 22 in (b), and 15 to 30 in (d). However, there is an exception: in Figure 6c, the initial phase step decreases from 6 to 2, which may be caused by the instability of the L1 signals.

Periodograms and phase matching from higher antenna. The Lomb-Scargle periodograms and the phase matching results of satellites G1, G8, G11 and G17 from higher antenna before and after rainfall. (a) 21 to 26. (b) 20 to 22. (c) 6 to 2. (d) 15 to 30.
3.3.3 Comparison of received signals from lower antenna before and after rainfall
Similar to the results associated with the antenna H2, Figure 7 shows the results from antenna H1 (height approximately 1 m) before and after the rainfall. The left panel in the figure shows that the frequencies of the interference signals either decrease slightly after the rainfall in (b), (c), and (d)) or have little change in (a). The right figures show that the initial phase steps of the interference signals increase from 23 to 25 in (a), from 5 to 8 in (c), and from 6 to 24 in (d). However, in (b), the initial phase step decrease from 26 to 22 which means the L1 signals have some instability.

Periodograms and phase matching. The results of satellites G1,G8, G11 and G17 from lower antenna before and after rainfall. (a) 23 to 25. (b) 26 to 22. (c) 5 to 8. (d) 6 to 24.
4. Other experiments
4.1 Experiments with vertical polarized and horizontal polarized antennas
Another experiment was conducted in Wuhan China, in 2013, as shown in Figure 8a. Two antennas (one is vertically polarized and the other is horizontally polarized) were used to record interference signals. The upper part of Figure 8b shows the SNRs of signals from GPS satellite G31 received by both vertically and horizontally polarized antennas vs. the elevation angle. A notch (the minimum oscillation observed in the interference signal) was shown in the solid line at about 20°, this agrees well with results reported in the literature [7], while the dash line shows damping oscillations. The difference is due to the fact that the phase of the vertical reflection coefficient experiences a sharp change from 0° to 180° at the Brewster angle. The lower part of Figure 8b shows the two signals in the Lomb-Scargle periodograms. The solid line, i.e., the spectral estimate of vertical polarization signal has line splitting and peak shifting which is different from the dash line. That shows that the spectrum method may suffer from the frequency error and is not suitable for the signals received by the vertical polarized antenna.

Experiment setup and periodograms. (a) Experiment setup with vertical and horizontal polarization antennas. (b) Lomb-Scargle periodograms of signals of satellite G31.
4.2 Analysis of L1 band data from GPS station of PBO
In order to test the phase shift of the interference signals received by continuous operating GPS receivers, the GPS data from station P037 of the PBO network in 2013 (downloaded from ftp://data-out.unavco.org/) and the soil moisture data (downloaded from http://xenon.colorado.edu/portal/) were used. In our study, the data in 3 days, i.e., Nov 20 (1120, dry soil, before the rain), Nov 22 (1122, wet soil during the rain), and Nov 23 (1123, wet soil, after the rain), are used. In order to perform a quantitative assessment of the phase shift caused by the soil moisture, we modified the model of V i in Section 3.2 into a three-parameter model, expressed by
where A i is the amplitude of interference signal in i th day, B i is the direct current component, ϕ i is the phase, and f is the frequency with the greatest power in the Lomb-Scargle periodogram of the first day (1120). A nonlinear curve fitting method based on the least squares estimation procedure is used to determine A i , phase ϕ i , and B i ; then, the relationship between the phase change Δϕ i = ϕi + 1 − ϕ1 and the soil moisture change Δsm i is identified.
Figure 9a shows the SNR data, de-trended SNR data, and nonlinear fitting results of L1 signals of GPS17 in 1120, 1122, and 1123. There are phase delays in the interference signals from 1120 to 1123. Figure 9b shows that when the soil moisture increased by 0.11 cm3cm−3 (from 0.102cm3cm−3 in 1120 to 0.215 cm3cm−3 in 1122), the change in the phases of satellites (including GPS satellites G12 G13 G15 G17 G29 etc. and both L1 signals and L2 signals) are around 5° to 10°. When the soil moisture increased by 0.33 cm3cm−3 (from 0.102 cm3cm−3 in 1120 to 0.438 cm3cm−3 in 1123), the change in the phase of these signals are around 15° to 20°. This relationship is in agreement with the empirical relationship for GPS L2 signals in [9].

SNR data and relationship. (a) SNR data, de-trended SNR and nonlinear fitting results of L1 signals in 3 days. (b) Relationship between the change of soil moisture and phase.
4.3 Analysis of L1 band data from GPS station of China CORS network
China has built Continuously Operating Reference Station (CORS) networks in many cities. From these networks, a Trimble GPS receiver located in Jiexi, Guangdong, China, was chosen.
GPS measurements from G24 satellite in 3 days (December 14, 15, and 16, i.e., 1214, 1215, and 1216 in Figure 10) are used because there was heavy rain in the last 2 days. A new phenomenon occurs, i.e., many noises distort the waveform of the interference signals, as shown in Figure 11 (upper) and Figure 10 (upper). In addition to the data processing process described in Section 3.2, two key steps are taken. One is to identify the effective frequency components in the Lomb-Scargle periodograph by searching the frequency components fL 1 and fL 2 in pairs as shown in Figure 11 (lower), where fL 1 and fL 2 are the frequencies of L1 and L2 multipath signals, respectively, λL 1 and λL 1 are wavelengths of GPS L1 and L2 signals. As shown in Figure 11 (lower), those signal components with other frequencies can be regarded as noise. The second step is to isolate these noises by the zero-phase filter; in addition, the periodic extension method should be employed to eliminate the border effects of the filter. Figure 10 (upper) shows the SNR data of L1 in 3 days (1214, 1215, and 1216) and curve fitting results in the lower figure; the phases are delayed after the rain. The estimated phase delay from 1214 is 15° in 1215 and 17° in 1216, respectively, which means the soil moisture increased by about 0.33 cm3cm−3 after the rain.

SNR data of L1 in three days and curve fitting results.

SNR data of L1, L2 of G24 and their Lomb-Scargle periodographs in 1214.
5 Discussions and conclusions
In this paper, several experiments were conducted to investigate the relationship between the soil moisture and interference signals with L1 frequency. The GPS data received from a low-cost commercial receiver and continuous operating GPS stations are employed. The power spectrum analysis method is used to investigate the frequency change of the interference signals while the cosine similarity method and nonlinear curve fitting method are used to identify the phase change.
From these experimental results, we can conclude that the interference signal of GPS L1 signal is closely related to the soil moisture. When the soil moisture increases, the interference signal's frequency may decrease or remain the same, while their phases increase. This relationship may be used for soil moisture estimation.
However, there are some issues that need to be dealt with when using GPS L1 signals to estimate soil moisture. One is the instability; although the phases increase after the rain most of the time, there are exceptions probably due to signal instability. It is thus useful to find the source of the instability to realize more robust estimation. The second issue is the noises or signals reflected from other objects instead of soil. These noises will distort the interference signals unless they can be removed by methods such as those proposed in Section 4.3.
For future research, we will investigate the characteristics of GPS L1 interference signals on instability, analyze the reasons behind it, and find the ways to maintain the stability to achieve reliable soil moisture estimation.
References
Jin SG, Feng GP, Gleason S: Remote sensing using GNSS signals: current status and future directions. Adv Space Res 2011, 47(10):1645-1653. 10.1016/j.asr.2011.01.036
Rodriguez Alvarez N, Bosch Lluis X, Camps A, Aguasca A, Vall Llossera M, Valencia E, Ramos Perez I, Park H: Review of crop growth and soil moisture monitoring from a ground‒based instrument implementing the Interference Pattern GNSS‒R Technique. Radio Sci 2011, 46(6):1-11.
Masters D, Axelrad P, Katzberg S: Initial results of land-reflected GPS bistatic radar measurements in SMEX02. Remote Sens Environ 2004, 92(4):507-520. 10.1016/j.rse.2004.05.016
Zavorotny V, Masters D, Gasiewski A, Bartram B, Katzberg S, Axelrad P, Zamora R: Seasonal polarimetric measurements of soil moisture using tower-based GPS bistatic radar. IEEE Int Geoscience Remote Sensing Symp 2003, 1(7):781-783.
Katzberg SJ, Torres O, Grant MS, Masters D: Utilizing calibrated GPS reflected signals to estimate soil reflectivity and dielectric constant: results from SMEX02. Remote Sens Environ 2006, 100(1):17-28. 10.1016/j.rse.2005.09.015
Rodriguez-Alvarez N, Camps A, Vall-Llossera M, Bosch-Lluis X, Monerris A, Ramos-Perez I, Valencia E, Marchan-Hernandez JF, Martinez-Fernandez J, Baroncini-Turricchia G: Land geophysical parameters retrieval using the interference pattern GNSS-R technique. Geoscience Remote Sensing, IEEE Trans 2011, 49(1):71-84.
Rodriguez-Alvarez N, Bosch-Lluis X, Camps A, Vall-llossera M: Soil moisture retrieval using GNSS-R techniques: experimental results over a bare soil field. IEEE Trans Geoscience Remote Sensing 2009, 47(11):3616-3624.
Zavorotny VU, Larson KM, Braun JJ, Small EE, Gutmann ED, Bilich AL: A physical model for GPS multipath caused by land reflections: toward bare soil moisture retrievals. IEEE J 2010, 3(1):100-110.
Chew CC, Small EE, Larson KM, Zavorotny VU: Effects of near-surface soil moisture on GPS SNR data: development of a retrieval algorithm for soil moisture. IEEE Trans Geoscience Remote Sensing 2014, 52: 537-543.
Larson KM, Braun JJ, Small EE, Zavorotny VU, Gutmann ED, Bilich AL: GPS multipath and its relation to near-surface soil moisture content. IEEE J Select Top Appl Earth Observ Remote Sensing 2010, 3(1):91-99.
Alonso-Arroyo A, Camps A, Aguasca A, Forte G, Monerris A, Rudiger C, Walker JP, Park H, Pascual D, Onrubia R: Improving the accuracy of soil moisture retrievals using the phase difference of the dual-polarization GNSS-R interference patterns. Geoscience Remote Sensing Letters, IEEE 11(12):2090-2094.
Ublox: ANTARIS LEA-4 GPS Modules datasheet. Swiss-based u-blox AG, U-blox.com, Switzerland; 2008.
Njoku EG, Entekhabi D: Passive microwave remote sensing of soil moisture. J Hydrol 1996, 184(1):101-129.
McKenzie N: Australian soils and landscapes: an illustrated compendium. CSIRO publishing, Victoria; 2004.
Lutron L: Soil Moisture Meter Model:PMS-714 Datasheet. Lutron ELectronic Enterprise co., LTD; 2007.
Topp GC, Davis JL: Measurement of soil water content using time-domain reflectrometry (TDR): a field evaluation. Soil Sci Soc Am J 1985, 49(1):19-24. 10.2136/sssaj1985.03615995004900010003x
Pardo-Iguzquiza E, Rodríguez-Tovar FJ: Implemented Lomb-Scargle periodogram: a valuable tool for improving cyclostratigraphic research on unevenly sampled deep-sea stratigraphic sequences. Geo-Mar Lett 2011, 31(5–6):537-545.
Møller AR: Use of zero-phase digital filters to enhance brain-stem auditory evoked potentials (BAEPs). Electroencephalogr Clin Neurophysiol 1988, 71(3):226-232. 10.1016/0168-5597(88)90007-X
Acknowledgements
The authors would like to acknowledge the support of the National Basic Research Program of China (2011CB707101). Partial support from the Australian Space Research Program (ASRP2) and the Australian Research Council (ARC-LP130100243) projects led by Prof Kefei Zhang is gratefully acknowledged. We also acknowledge Dr Suqin Wu for her valuable and constructive suggestions.
Author information
Authors and Affiliations
Corresponding author
Additional information
Competing interests
The authors declare that they have no competing interests.
Authors’ original submitted files for images
Below are the links to the authors’ original submitted files for images.
Rights and permissions
Open Access This article is distributed under the terms of the Creative Commons Attribution 2.0 International License (https://creativecommons.org/licenses/by/2.0), which permits unrestricted use, distribution, and reproduction in any medium, provided the original work is properly cited.
About this article

Cite this article
Yan, S., Li, Z., Yu, K. et al. GPS-R L1 interference signal processing for soil moisture estimation: an experimental study. EURASIP J. Adv. Signal Process. 2014, 107 (2014). https://doi.org/10.1186/1687-6180-2014-107
Received:
Accepted:
Published:
DOI: https://doi.org/10.1186/1687-6180-2014-107