- Research
- Open access
- Published:
Pitch-informed solo and accompaniment separation towards its use in music education applications
EURASIP Journal on Advances in Signal Processing volume 2014, Article number: 23 (2014)
Abstract
We present a system for the automatic separation of solo instruments and music accompaniment in polyphonic music recordings. Our approach is based on a pitch detection front-end and a tone-based spectral estimation. We assess the plausibility of using sound separation technologies to create practice material in a music education context. To better understand the sound separation quality requirements in music education, a listening test was conducted to determine the most perceptually relevant signal distortions that need to be improved. Results from the listening test show that solo and accompaniment tracks pose different quality requirements and should be optimized differently. We propose and evaluate algorithm modifications to better understand their effects on objective perceptual quality measures. Finally, we outline possible ways of optimizing our separation approach to better suit the requirements of music education applications.
1 Introduction
Sound source separation is the signal processing task that deals with the extraction of unknown signals or sources from an audio mixture. In the case of musical signals, a possible sound source separation task would be to obtain independent signals for the saxophone, piano, bass, and percussion, given a recording or audio mixture of a jazz quartet.
This paper focuses on a particular case of sound source separation called solo and accompaniment separation, also referred to as lead or main instrument separation or de-soloing. For this specific task, the goal is to separate the audio mix into two sources only: the main instrument or solo and the accompaniment. The accompaniment refers to one or more instruments playing along with the solo. In the jazz quartet example, solo and accompaniment separation would result in an independent track for the saxophone (assuming that the saxophone plays the solo part in the track) and an accompaniment track composed of the piano, bass, and percussion. As the term backing track is commonly used in the audio production community to refer to the accompaniment tracks, these two terms are used interchangeably throughout the paper. For the solo/accompaniment separation task, the solo is assumed to be the instrument playing the main melody of the piece. In an attempt to have a clear definition to work with, the music information retrieval (MIR) community commonly refers to main melody as the single (monophonic) pitch sequence that a listener might reproduce if asked to whistle or hum a piece of polyphonic music and that a listener would recognize as being the ‘essence’ of that music [1].
After many years of sound separation research, results suggest that separation performance can be improved when prior information about the sources is available. The inclusion of known information about the sources in the separation scheme is referred to as informed sound source separation (ISS) and comprises, among others, the use of musical instrument digital interface (MIDI)-like musical scores, the use of pitch tracks of one or several sources, oracle sound separation where the original sources are available, and the extraction of model parameters from training data of a particular sound source. The reader is referred to [2] for a general overview of informed sound source separation approaches.
The system described in this paper attempts to separate solo instruments from music accompaniment in polyphonic music using pitch as prior information. This approach will be referred to as pitch-informed solo/accompaniment separation.
2 Research goals and paper outline
2.1 Research goal
We attempt to develop of a system for solo and accompaniment separation to be used in the music education context. The system should be capable of separating main instruments from music accompaniment, regardless of the type of solo instrument used, musical genre of the track, or type of music accompaniment. For the solo instrument, only pitched instruments are considered and no attempt is made to separate percussive instruments. We focus on the monophonic case, where the solo instrument is assumed to play only one note at a time. Only the single-channel or monaural separation problem is addressed where no spatial or panning information can be used. The algorithm should be lightweight and processing times should be minimized to allow its use in real-world applications. The usability of our algorithm in ‘music education and practice’ applications is addressed by considering efficiency and quality requirements in this context and proposing algorithm enhancements to meet such requirements. A perceptual listening test in the context of musical instrument learning is conducted to obtain practical insights on how to optimize our algorithm for this context. Refer to Section 5 for a short introduction about the use of MIR technologies in music education.
2.2 Main contributions
The main contributions of this research work are listed in the following categorized as major and minor contributions. Major contributions: (1) an efficient method for pitch-informed solo/accompaniment separation based on spectral estimation of tone objects. The tone-based processing is a musically meaningful segmentation of the audio signal that allows the inclusion of known characteristics of instrumental tones such as the post-processing stage presented in Subsubsection 4.1.5 and common amplitude modulation presented in Subsection 4.3 and (2) a novel method to include common amplitude modulation (CAM) characteristics in the separation scheme. Minor contributions: (3) a novel listening test setup to evaluate the use of solo/accompaniment separation in music education applications. Results from the listening test give clear directions on how to optimize separation algorithms to meet quality requirement of music education applications, and (4) collection of a new dataset for solo/accompaniment separation where both vocal and instrumental solos from different genres are included. The dataset is publicly available to the research community.
2.3 Paper outline
To introduce the reader to the state-of-the-art of separation research and put our approach into context, a brief overview of current sound source separation approaches is provided in Section 3. In Section 4, the details of the proposed system are described and its evaluation is presented in Subsection 4.2. Algorithm modifications and their evaluation are presented in Subsection 4.3. In Section 5, we evaluate the use of solo/accompaniment separation in ‘music education’ applications. Final comments and future directions are presented in Section 6.
3 Related work
Several techniques have been proposed in the literature for the solo and accompaniment separation task. Each approach takes advantage of different signal properties or models the separation problem in slightly different ways: sparsity constraints, spatial cues, source models, and prior information are all different approaches that have been applied in the separation task.
Signal sparsity for example, has been exploited in several approaches. In [3], a system for singing voice separation is proposed where the singing voice is modeled as a high-rank but sparse signal in the time-frequency domain. On the other hand, the accompaniment is modeled as a low-rank signal due to its assumed repetitive structure. Robust principal component analysis (RPCA) is used as factorization scheme to extract the desired sources. Another approach that takes advantage of the repetitive structure of the accompaniment is presented in [4]. The system first identifies the repeating period p of the signal using an autocorrelation approach to calculate a beat spectrum. The algorithm then models the repeating segment S as the element-wise median of the r segments of length p in the spectrogram. The repeating patterns are finally extracted using a soft masking approach.
Other approaches have used spatial cues for source localization to perform the separation task. In [5], an approach for singing voice extraction in stereo recordings is presented. Here, panning information in conjunction with a probabilistic pitch tracking approach is used. A latency of 250 ms is achieved allowing online processing. Other approaches that have used spatial cues in the separation task are presented in [6] and [7].
Source/filter models are often used to model solo instruments and the voice. The system described in [8] proposes a mid-level representation of the audio signal assuming an instantaneous mixture model (IMM) of the target source and the residual. The solo instrument is represented with a source/filter model where the source carries pitch information and the filter timbral information. Non-negative matrix factorization (NMF) and soft masking are used to extract the final signals.
Pitch has also been used as prior information when performing separation. Some approaches make use of f 0 (fundamental frequency) sequences extracted with pitch detection algorithms as front-ends. Others, directly use MIDI-like symbolic music representations. While using pitch detection is a flexible approach that only requires the original mix, separation performance completely relies on the results obtained from the pitch detection front-end. Score-informed separation removes the difficulties inherent to pitch extraction but also comes with its own challenges. Due to artistic liberties taken in musical performances, audio recordings will never be completely synchronized with music scores. It is then necessary, before any separation is attempted, to align score and audio as precisely as possible. A common approach to address this issue is the use of dynamic time warping (DTW) to find the optimal match between the two sequences. In [9] for example, a system for high-resolution synchronization of audio streams via chroma-based onset features is presented. In [10], the authors present a score-informed separation algorithm based on probabilistic latent component analysis (PLCA). PLCA can be understood as a probabilistic interpretation of NMF which decomposes the magnitude spectrogram as a sum of outer products of spectral and temporal components; its major benefit being the possibility to incorporate prior distributions in the decomposition. The system uses score information to separate the harmonic instruments in the audio mix and DTW to synchronize the score to the audio track. Synthesized versions of the score parts corresponding to each audio source are decomposed into temporal and spectral components using PLCA. These components are then used as prior distributions in the PLCA decomposition of the original mix. In [11], a method for solo instrument separation in stereo recordings is proposed. The system uses MIDI-like scores of the lead instrument as prior information and chroma-based DTW to address global misalignments between the score and the audio signal. A MIDI confidence measure is proposed to deal with small-scale misalignments. The confidence measure gives a lower weight to attack and offset regions of each note and a higher weight to the sustained part of the notes. The aligned score information is used as a rough pitch estimate of the lead instrument and used to guide a pitch tracking stage. A two-step Viterbi algorithm is used to refine the pitch track obtained from the score. For each frame, a set of probabilities is computed based on the score information, pitch likelihood, and a transition probability based on frequency continuity. The first Viterbi step delivers one f 0 value per frame; the second Viterbi step finds the best path in the matrix. A harmonic mask and a pan-frequency mask are used to filter the solo instrument from the mixture. The system is tested on a specially produced dataset of 13 excerpts where the solo instrument is played by a human performer and centrally panned. The accompaniment is spatially distributed and synthetically produced with sound libraries. Other score-informed separation approaches are presented in [12] and [13], and a thorough overview of score-informed separation approaches is presented in [14].
An interesting approach is presented in [15] where computational auditory scene analysis (CASA) elements are introduced in the separation scheme. The system attempts to separate sound sources in monaural recordings using multi-pitch information of the sources obtained either from a MIDI-like score or from the multi-pitch detection algorithm presented by Klapuri in [16]. The multi-pitch information is used to differentiate overlapped harmonics from non-overlapped ones. This is performed by assuming harmonicity of the sources and by the use of a frequency threshold that assigns a set of frequency bins to a given harmonic. Harmonic masks are created for each of the sources by first refining the pitch estimates as the weighted average of the instantaneous frequency of the harmonics divided by their harmonic number. A new set of frequency bins is then assigned to each harmonic based on the refined pitch estimate. In the case of overlapped harmonics, the CAM principle (which is further explained in Subsection 4.3) is applied in a least square estimation. The underlying assumption here is that the amplitude envelopes of the harmonic components of a source are correlated. In this system, the envelope of the strongest non-overlapped harmonic is used to estimate the envelopes of the overlapped ones. The system is evaluated with a dataset created from 20 MIDI files of Bach quartets where either two or three of the voices are created by inserting instrument notes taken from the RWC music instruments dataset.
One of the main difficulties of pitch-informed sound separation is the fact that errors in the pitch detection stage inevitably propagate to the separation stage. Bearing this in mind, some approaches have been proposed for supervised pitch extraction with a consequent separation scheme [17–19]. In [20] for example, a probabilistic model of the constant Q transform (CQT) is proposed for the estimation of polyphonic pitch content. Notes are modeled with time-frequency activations and normalized harmonic spectra. A sparseness prior is introduced for the note activations to guarantee that the data will be represented with the least amount of active notes possible. Through a specially designed interface, the user can choose the pitches to be extracted by clicking on them. Separation is performed with time-frequency masking in the CQT domain.
Tensor factorization approaches have also been proposed to address the separation task [21]. In [22], a generalized coupled tensor factorization (GCTF) approach is used to jointly include harmonic information from an approximate score and spectral information from instrument recordings. The system uses music scores as prior information but relaxes the alignment constraint between score and audio. The authors showed that a strict alignment between audio and score is not necessary when note co-occurrences, which are the same in the score and audio signal, are exploited.
Some systems have been proposed that use existing example signals to perform separation. In [23], prior information is given in the form of multi-track signals of a cover interpretation of the song that guide the separation process. In [24], the user provides a version of the target source by humming the desired melody line. Similarly, in [25], an approach for common signal extraction is proposed with the goal of extracting a common music accompaniment among a set of soundtracks with lyrics in different languages. The common signal is in this case, the accompaniment music plus effects which is the same in all the soundtracks.
4 Proposed system
In the following sections, our proposed method is described and evaluated. First, an overview of the system is presented where each of the processing stages is described. The performance of the algorithm is then evaluated on a new dataset described in Subsubsection 4.2.1. To place our algorithm in context of state-of-the-art approaches, results from the Signal Separation Evaluation Campaign (SiSEC 2013) are presented. Finally, a series of algorithm variations are described and their effects on the quality of resulting tracks are evaluated.
4.1 System overview
In this section, the main processing stages of our proposed method, developed to be used in music education applications, are described. For reference, a block diagram of the proposed algorithm is presented in Figure 1.

Block diagram of the proposed algorithm. The intermediate signals passed between processing stages are also displayed. The lower arrow connecting the input signal and block A indicates that the complex-valued spectrogram F(k,n) is used in all the processing stages contained in A.
The main characteristic of the proposed algorithm is its tone-based separation approach. In this work, a tone is defined as a sound with distinct pitch and duration and it is characterized by its onset, offset, and frame-wise frequency values. Instead of performing the separation task on a frame-by-frame basis, the algorithm gathers information of complete tones for processing. This allows more musically and acoustically meaningful processing as known characteristics of tone objects can be exploited in the separation scheme. Additionally, a post-processing stage is proposed to remove artifacts and possible interferences from other sources. This stage is computationally efficient and particularly effective for removing interference from percussive events in the solo signal.
In the next sections, the following notation applies: Let F(k,n) be the short-term Fourier transform (STFT) of length N of a monaural signal f(t) and |F(k,n)| its magnitude spectrogram, with k the frequency bin index and n the time frame index. We aim to decompose |F(k,n)| into a solo component |S(k,n)| and an accompaniment component |A(k,n)|. The magnitude spectrogram of the audio signal is modeled as follows: |F(k,n)|=|A(k,n)|+|S(k,n)|.
4.1.1 Pitch detection
In our system, the pitch detection algorithm proposed in [26] is used as a front-end. The author addresses the task of melody extraction from polyphonic music with an approach divided in four processing stages: (1) spectral representation, (2) pitch candidate detection and tone formation, (3) voice formation, and (4) main melody selection. A spectral representation is obtained starting with a multi-resolution spectrogram that provides a good trade-off between time resolution for higher frequencies and frequency resolution in the lower range. Magnitude and instantaneous frequency (IF) values are obtained for each peak within the frequency range of 55 Hz to 5 kHz. The magnitude of each spectral peak is weighted using its instantaneous frequency value. This way, higher frequency peaks which frequently have lower magnitudes but can still be valid fundamental frequencies, are boosted. Each spectral peak is either assigned to a previously existing tone (if it can be explained by the spectral envelope of such tone) or is used to detect new salient pitches. To detect new salient pitches, a pair-wise evaluation of spectral peaks, which tries to detect partials with successive harmonic numbers, is used in conjunction with a set of perceptually motivated ratings. These ratings include a harmonicity threshold defined as a maximum deviation of 120 cents from the exact harmonic interval between the peaks, a measure to guarantee a degree of spectral smoothness, and a harmonic impact measure that reduces the impact of higher harmonics. In the voice formation stage, each voice is characterized by its magnitude and frequency range. A tone is assigned to a voice if it passes the magnitude threshold and lies within the frequency range of the voice. After different voices have been created, the most salient stream is selected as the main melody. In cases where no clear difference exists between the magnitude of two voices, a frequency weighting is applied that gives lower weight to voices in the lower frequency range.
During pitch extraction, an analysis frame of 46 ms was used in conjunction with a hop size of 5.8 ms. The pitch detection algorithm returns fundamental frequency sequences f 0(n) of the main melody on a frame-by-frame basis. Unpitched frames are marked with f 0(n)=0 Hz.
4.1.2 Tone formation
The goal of the tone formation stage is to create tone objects from the f 0(n) sequence delivered by the pitch detection stage. The importance of the tone-based separation is that it allows a musically meaningful segmentation of the audio signal. This segmentation takes advantage of known characteristics of musical tones (such as the post-processing stage presented in Subsubsection 4.1.5 and the common amplitude modulation approach described in Subsection 4.3). Furthermore, it yields an efficient processing with minimal memory requirements.
The raw f 0 estimates from the pitch detection stage are analyzed over time to create tone objects. When no melody is detected, the pitch detection stage delivers f 0 values equal to 0 Hz. A new tone is only started when an f 0 value in the [65 Hz, 2,000 Hz] range is found. This range roughly corresponds to 5 octaves starting in C2 and ending in B6. After the start of a tone has been detected, a moving average filter of length L a =3 frames is used to calculate the mean frequency value in the time interval defined by the filter length L a . That is:
The end of a tone is defined either by a new f 0= 0 Hz (no tone was detected) or by a mean frequency variation larger than a semitone (a new tone has started). Low and high semitone intervals from are calculated using the cent units of measure. The interval is then given by [, ]. To remove any spurious tones, a minimum tone length of 100 ms which is roughly a 16th note at 140 bpm is defined. After this stage, each tone object is defined by its start frame n i , end frame n f , and an IF value for each of the frames in the tone. Capturing frame-wise IF values allows minor pitch variations that can occur within a tone. We define n i and n f as the vectors containing the start and end frames of all the detected tones, respectively.
4.1.3 Harmonic series estimation
The goal of this stage is to construct a harmonic series that represents the solo instrument and that is consistent with the tone objects found in the previous stage. Two underlying principles are used: (1) each harmonic component is allowed to have an independent deviation from the calculated ideal location of the harmonic, i.e., multiple integer of the fundamental frequency. (2) The acoustic differences between the voice, string, and wind instruments need to be considered when harmonic components are located. Namely, inharmonicity characteristics differ between instrument families. A well known characteristic of conical bore instruments, for example, is the flattening of upper resonances in relation to the fundamental component due to open end corrections in the tone hole lattice [27]. In contrast, string instruments experience inharmonicty patterns that deviate to the higher end of the calculated harmonic location [28]. The harmonic estimation stage is kept consistent with either lower or higher deviations from harmonic locations but never a mix of both.
We use the index p as the partial index, with p=1 representing the fundamental frequency and p=pmax representing the highest partial considered in each tone. We also define k p (n) as the frequency bin of the ideal partial location of partial p (calculated as integer multiple of the fundamental frequency). Finally, we define δmax as the maximum frequency deviation that each partial p is allowed to have from its ideal harmonic location.
For each time frame n in the range defined by [ n i ,n f ], where n i is the initial detected frame of the tone, and n f is the final frame of the tone, we define a frequency band given by [ k p (n)−δmax,k p (n)+δmax] where we search for the observed partial location. We conduct an iterative search in the vicinity of the ideal partial location k p (n) for all partials with partial index p=2,…,pmax. For each partial index p, the search returns the frequency bin where we detect the observed harmonic with the largest amplitude. A detection mask D(k,n), where we mark the observed harmonics with 1 for each frame, is defined for k in the [ 1,N/2] range:
4.1.4 Spectral masking
After the complete harmonic series has been estimated, initial binary spectral masks for the solo M S (k,n) and accompaniment M A (k,n) are created. At this stage, each time-frequency tile is defined either as part of the solo instrument or part of the accompaniment. To compensate for spectral leakage in the time-frequency transform, a tolerance band Δ centered at the observed partial location , is included in the masking procedure. Thus, for a frequency range and time frame n ∈ [ n i ,n f ] we have:
4.1.5 Post-processing
The post-processing stage evaluates each tone as a whole and addresses the following: (1) attack frames, and (2) interference of transients in the solo signals.
The pitch detection algorithm requires a few processing frames before a valid f 0 value can be detected. This delay is because clear spectral peaks are needed for the estimation, and this mostly happens in the sustained part of the tone.
To compensate for this inherent delay, a region of 70 ms before the initially found start of each tone n i , is modified. The observed harmonic structure M S (k,n i ) in frame n i is replicated in all the frames 70 ms before n i .
Overlapping of spectral information from different sources often causes percussion hits and attacks from other sources to be detected as part of a tone of the target source. Bearing in mind that percussion onsets are evident in the spectrogram as vertical events occurring in a short time interval [29], an additional analysis is performed where sudden magnitude peaks occurring simultaneously in several harmonic components, are detected.An example saxophone tone where such events can be observed is shown in Figure 2. The figure shows the estimated tone before post-processing. The red arrows indicate two percussive hits that were initially estimated as part of the solo signal. Even when the magnitudes of these events are not particularly large in comparison to the lower partials of the tone, the perceptual impact of such events is considerable, being in most cases clearly audible and disturbing. It can be observed that these events are common to all harmonics and occur in a short interval of time.

Estimated saxophone tone before post-processing. The red arrows indicate the places where elements from two percussive events are mistakenly taken as being part of the solo instrument.
To detect these transients in the solo signal, the temporal envelope of each partial, denoted e
p
(n), is smoothed with a median filter of length L. Let  denote median filtering. The smoothed magnitude envelopes are thus obtained as follows: . The smoothed magnitude envelopes are normalized to the [ 0,1] range. As the perceptual impact of transients is stronger for higher partials, we define plow as the lowest partial index considered for the detection of transients. This analysis is only performed for partials with partial index p>plow. We define a magnitude threshold γ
L
, and for all partials with partial index p>plow, we detect the time frames where the normalized smoothed magnitude envelopes have amplitudes larger than γ
L
. As the sudden magnitude peaks should be simultaneously observed in several partials, we define minp as the minimum number of partials where a magnitude value larger than γ
L
has to be observed for the event to be considered a transient.
denote median filtering. The smoothed magnitude envelopes are thus obtained as follows: . The smoothed magnitude envelopes are normalized to the [ 0,1] range. As the perceptual impact of transients is stronger for higher partials, we define plow as the lowest partial index considered for the detection of transients. This analysis is only performed for partials with partial index p>plow. We define a magnitude threshold γ
L
, and for all partials with partial index p>plow, we detect the time frames where the normalized smoothed magnitude envelopes have amplitudes larger than γ
L
. As the sudden magnitude peaks should be simultaneously observed in several partials, we define minp as the minimum number of partials where a magnitude value larger than γ
L
has to be observed for the event to be considered a transient.
To remove the detected transients, the value of the solo spectral mask M S (k,n) in the time frame where the transient was detected is replaced by the mean magnitude value of the normalized smoothed magnitude envelope μ e in the L time frames before the transient was detected: Let k t and n t be the frequency bin and time frame where the transient was detected, respectively. The mean value μ e is then calculated as follows: . The new value of the spectral mask is then given by M S (k t ,n t )=μ e . This introduces a smoothness constraint in the temporal envelopes of the partials. The number of time frames that determine the smoothness constraint of the temporal envelopes is given by the filter length L. The new spectral mask is no longer binary and is denoted . The accompaniment mask is also recalculated as .The effect of the transient removal stage can be observed in Figure 3 where the same saxophone tone from Figure 2 is shown after post-processing. The red arrows indicate the location where the percussive events were located. It can be seen that this processing stage guarantees a degree of smoothness in the temporal envelopes of the tone. It also has to be noted that the attack frames included in the previous processing stage are not considered in the transient detection stage. This has the advantage that the transient-like characteristics of attacks are preserved in the solo signal; however, this approach fails to remove percussion hits that coincide with the attacks of the solo instruments.

Estimated saxophone tone same as in Figure 2 after the post-processing stage has been applied. The red arrows indicate the places where elements from two percussive events had been originally assigned to the solo instrument. As can be observed, the post-processing stage greatly reduces the interference from percussive hits in the solo signal.
The post-processing stage is a lightweight but effective approach to remove transients from the solo signal and to improve the attack portions of the tone. It has the benefit of only being performed in the time frames where the solo instrument has been detected and removes the need of performing a previous harmonic/percussive separation to avoid percussive interference in the solo signal.
4.1.6 Re-synthesis
The complex valued spectrogram from the original mix is masked and independent solo and accompaniment tracks are re-synthesized by means of the inverse short-term Fourier transform (ISTFT). In our approach, no attempt is made to estimate the phase of the target sources, and the phase of the original mix is used for re-synthesis of both sources. The solo and accompaniment spectrograms are given by and , respectively. Here, ⊗ denotes the Hadamard product. The resulting solo and accompaniment tracks are then s(t)=ISTFT(S(k,n)) and a(t)=ISTFT(A(k,n)).
4.2 Evaluation
In this section, the performance of our proposed method is evaluated. Three important factors were considered for this evaluation. (1) As algorithm robustness under various signal conditions is of critical importance for our proposed application, special effort was made to create a dataset as varied as possible containing both vocal and instrumental tracks. (2) The quality of both the solo and the accompaniment tracks are of critical importance for the proposed application, and for that matter, the evaluation and analysis of results are always conducted separately for solo and accompaniment tracks. (3) Bearing in mind that quality requirements are different for all applications, the importance of each of the quality measures is highly dependent on the application at hand. For this matter, the general quality of the signals as well as the particular distortion measures (explained in Subsubsection 4.2.2) are analyzed independently.
4.2.1 Dataset
To guarantee robustness in the performance of our algorithm over a wide range of signal conditions, musical genres, and instrumentations, a new dataset of multi-track recordings was collected. Several important factors were considered when collecting the dataset. (1) All the signals had to be copyright-free to allow the dataset to be made publicly available. (2) Both vocal and instrumental tracks had to be included. The new dataset contains both female and male singers, as well as instrumental solos from the clarinet, saxophone, trumpet, electric guitar, acoustic guitar, whistle, and kazoo. (3) Different musical genres such as classical, pop, rock, and jazz were included in the new dataset. In particular, different instrumentations including percussive instruments were considered. Percussive instruments have proven to be challenging in solo instrument separation often creating undesired artifacts and transients in the solo signals.
The dataset is composed of 17 multi-track recordings: 10 tracks with vocal solos and 7 tracks with different instrumental solos. The recordings were collected from different sources: SiSEC [30], TRIOS Dataset [31], and CCMixter [32]. All the signals were re-mixed to obtain solo, backing, and mix signals. The dataset used and a description of the individual signals are available on our project website [33].
4.2.2 Results
The PEASS toolbox [34] was used to evaluate quality of the separated signals. This toolbox presents a family of four objective measures to assess the perceptual salience of the target distortion, interference, and artifacts. The family of objective measures is composed of the overall perceptual score (OPS), the target-related perceptual score (TPS), the interference-related perceptual score (IPS), and the artifacts-related perceptual score (APS). All the measures take values from 0 to 100 with higher values indicating better perceptual quality. The PEASS toolkit was chosen for the evaluation as it is the only available set of quality measures that incorporates both objective and subjective elements. Furthermore, this toolkit is widely used in the separation community and it is the chosen evaluation method in public separation campaigns as SiSEC (see Subsubsection 4.2.4 for more information on the SiSEC campaigns). Using state-of-the-art quality measures allows comparison of results with other approaches. Additionally, the resulting signals are also made available for listening on our results website [33].
The entire dataset was processed with our method, and perceptual quality measures were calculated. The following processing parameters were used: pmax=25 based on observations of different instrument spectra. Wind instruments in particular can exhibit up to 25 clear harmonic components. The tolerance band was set to Δ=1. Larger values of Δ would result in perceptible interference from other sources in the target source. For the post-processing stage, plow=9 was selected as higher values showed to be too restrictive and failed to remove certain percussive interferences. The minimum number of partials used for transient detection was set to minp=6. A filter length value L=5 and γ L =0.6 were used as they showed to be a good balance between proper handling of spectral leakage and magnitude variations in magnitude envelopes. An analysis frame of 46 ms was used in conjunction with a hop size of 5.8 ms.
In order to better assess the performance of our proposed method, all the tracks from the dataset were manually processed by musical experts to extract ground truth pitch information. The Songs2See Editor interface [19] was used for this matter. The pitch sequences of the solo instrument were manually corrected up to the time and frequency precision offered by the software; however, a frame-wise precision cannot be guaranteed. The extracted ground truth pitch sequences were used as prior information for our proposed method (bypassing the pitch detection stage), and separation was conducted for the complete dataset.
The resulting objective perceptual measures are presented in Figure 4. Results are displayed separately for the solo and backing tracks both with the fully automatic method and with ground-truth pitch information. Mean values with 95% confidence intervals are presented. In this section, results for the automatic algorithm will be referred to as solo and backing. Results using ground-truth information will be referred to as solo-U and backing-U.

Objective perceptual quality measures obtained with our proposed method for the entire dataset. Overall perceptual score (OPS), target-related perceptual score (TPS), interference-related perceptual score (IPS), and artifact-related perceptual score (APS). Results are displayed separately for solo and backing tracks. Red (triangle) and blue (square) markers display results from our proposed method for the solo and backing, respectively. Gray markers (triangle and square) display results obtained using ground-truth pitch information.
Consistently high IPS were obtained for the solo signals. This evidences the fact that special care was taken, specially in the post-processing stage (Subsubsection 4.1.5), to remove all traces of interference in the solo signals. However, such IPS scores come at the expense of low TPS and APS. These results suggest that our spectral estimation approach might be too strict, resulting in target sources reconstructed out of accurate but restricted time-frequency information. For the backing tracks, more homogeneous measures were obtained. Results for the backing tracks show high TPS as well as high APS. These results support once again the fact that a very conservative solo extraction approach has been taken, resulting in a minimum amount of intervention for the extraction of backing tracks and resulting in high APS and TPS scores.
Important conclusions can also be drawn by analyzing the scores obtained with ground truth information. As expected, all the scores obtained for solo-U and backing-U are higher than the ones obtained for solo and backing, with the exception of the APS obtained for backing-U and the IPS obtained for the solo-U. However, this result is consistent with our previous remarks. By having more accurate and complete pitch information, more algorithm intervention is performed in the attempt to extract solo tracks and more algorithm artifacts might be created in the process. Similarly, more time-frequency information from the backing sources is taken as part of the solo, explaining the slightly lower IPS score for the solo-U. It is important to note that as expected, having accurate pitch information results in improved separation quality. However, even with ground-truth pitch information, perceptual scores are still far from reaching maximum values. This is a clear indication that spectral estimation and masking limit separation quality much more than pitch extraction. Bearing in mind that masking techniques on the magnitude spectrogram as the ones used here have their own theoretical boundaries, these results suggest that more complete knowledge about the time and frequency characteristics of sound sources and alternative masking techniques that possibly include phase information might be needed to consistently improve separation quality.
4.2.3 Evaluation of pitch detection front-ends
Our solo and accompaniment separation algorithm relies on the use of the pitch sequence of the solo instrument as prior information. In this section, we test the performance of our separation algorithm using an alternative pitch detection approach as front-end (Alg2) and compare results with the original algorithm (Alg1) described in Subsubsection 4.1.1. Both algorithms were chosen as they have shown superior performance in the MIREX campaigns in recent years. See [1] for a thorough comparison of the performance of pitch detection algorithms in the past MIREX. As previously mentioned, robustness under different signal characteristics is of critical importance for the application proposed. It is then necessary to guarantee that all the processing blocks are capable of handling different types of musical signals without considerable quality variations. For this matter, an evaluation of the two melody detection algorithm is conducted with two main goals. (1) Test the algorithms under a new dataset where the characteristics of the tracks used are entirely known. This dataset allows independent analysis for instrumental and vocal tracks. (2) Evaluate the pitch detection algorithms within the separation scenario. The performance of these algorithms will only be assessed within the separation scheme, that is, we only evaluate which of the two algorithms results in better separation performance. A thorough evaluation of pitch detection performance goes beyond the reach of this paper and will not be conducted. The goal of this study is to assess the effect and contribution of pitch detection within the method proposed.
In the following, the two pitch-detection algorithms are described:
-
1.
Algorithm 1: pitch estimation by pair-wise evaluation of spectral peaks
The first algorithm to be evaluated is the system presented in [26] which was thoroughly described in Subsubsection 4.1.1.
-
2.
Algorithm 2: melody extraction using pitch contour characterization
In [1], the authors propose a method for melody extraction from polyphonic music by pitch contour extraction and characterization. In this approach, pitch contours are defined as time continuous sequences of f 0 candidates grouped based on auditory streaming cues such as harmonicity, pitch continuity, and exclusive allocation. This approach is divided in four processing stages: (1) sinusoid extraction, (2) salience function, (3) pitch contour creation, and (4) melody selection. For the sinusoid extraction, an equal loudness filter is first applied to enhance the frequencies to which the human auditory system is more sensitive. The STFT is applied and IF and instantaneous amplitude values are obtained using phase differences. In order to obtain a salience function, an approach which computes the salience of a given frequency as the sum of the weighted magnitudes at integer multiples of that frequency is used. A compression parameter and a magnitude threshold are defined to prune the peak candidates and a frequency range of 55 Hz to 1.76 kHz is considered. To create the pitch contours, initial peak candidates are filtered using a salience threshold and a deviation threshold. The salience threshold is computed in relation to the highest peak in the frame, and the deviation threshold is calculated using the salience mean and standard deviation of all remaining peaks. The final peaks are grouped into contours using heuristics based on auditory streaming cues. For each contour a set of features is calculated: pitch mean, pitch standard deviation, contour mean salience, contour total salience, contour salience deviation, length, and vibrato presence. For the melody selection stage, an initial voicing detection stage determines when the main melody is present and when it is not by setting a voicing threshold slightly below the average contour mean salience. Octave errors are also addressed by comparing pitch trajectories, which in case of octave relationships, will be almost identical with an octave separation. The correct contour is always assumed to be the most salient of the two and has to be somehow continuous with the other melody contours. If more than one contour are still present in a certain frame, the melody is selected as the peak belonging to the contour with the highest total salience.An example plot that demonstrates the performance of the algorithm is presented in Figure 5. The original spectrogram of the signal is displayed as well as the detected melody (shown in green). White markers indicate two sections where the algorithm failed to recognize the main melody, and consequently, these frames were marked as unvoiced.
Figure 5 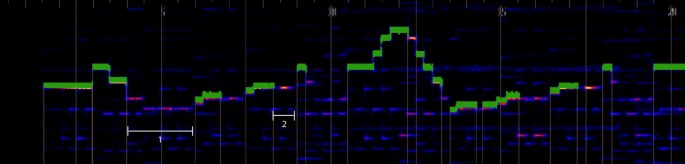
Example excerpt processed with Alg2. The original spectrogram is shown in the background, and the detected melody is shown in green. Two segments where the algorithm fails to detect the main melody are marked with a white marker.

4.2.3.0 Implementation aspects
As both pitch detection algorithms deliver frame-based f 0 sequences, an intermediate processing stage was implemented where f 0 sequences are converted into tones. This stage was required as in our proposed method, a tone-based separation scheme is proposed. The details of the tone formation stage are described in Subsubsection 4.1.2.
For Algorithm 1 (Alg1), a C++ implementation was used that delivers f 0 sequences as output. The resulting sequences are then used as input to the separation scheme. For Alg2, the available VAMP plug-in for Sonic Visualiser[35] was used and annotations were used as inputs to our separation algorithm.
4.2.3.0 Results
The complete dataset described in Subsubsection 4.2.1 was processed using pitch information extracted from the two pitch detection algorithms. Objective perceptual measures were calculated, and mean values with 95% confidence intervals are presented in Figure 6. It is important to bear in mind that results obtained with Alg1 correspond to the same results as the ones presented in Subsubsection 4.2.2 for our proposed approach. In this section, we further evaluate results by presenting independent scores for the backing and solo tracks with the vocal and instrumental tracks separately. Furthermore, results obtained with the ground-truth pitch information are also presented for reference (referred to as Prior in the figure). Figure 6a,b shows the scores for the solo tracks for the voice and instrument datasets, respectively. Similarly, Figure 6c,d shows the scores for the backing tracks for the voice and instrument datasets, respectively.

Objective perceptual quality measures. (a) Solo: voice dataset. (b) Solo: instrument dataset. (c) Backing: voice dataset. (d) Backing: instrument dataset. Overall perceptual score (OPS), target-related perceptual score (TPS), interference-related perceptual score (IPS), artifact-related perceptual score (APS). Results with the two pitch detection algorithms (Alg1, Alg2) are presented. For comparison purposes, results obtained with ground-truth prior information are also presented (Prior).
Results show very minor overall performance differences between the two algorithms, obtaining in general comparable perceptual scores. However, a few important differences can be outlined: Alg2 shows in general more variability of results obtaining slightly larger confidence intervals. This indicates that Alg1 can better handle signals with different spectral and acoustical characteristics. Additionally, we focus on the IPS of the backing tracks as a good indicator of the quality of pitch detection - the only source of interference, in this case, is the solo instrument. Alg1 obtained a slightly higher IPS score for the backing tracks with the instrument dataset. Alg2 obtained a higher IPS score for the backing tracks with the voice dataset. Both of these IPS scores are slightly lower than the ones obtained with Prior, which represents the performance boundary for the proposed separation scheme. These results suggest that Alg1 might be more suitable to handle instrument tracks and Alg2 slightly better for vocal datasets. For both algorithms, scores obtained for the instrument dataset are higher than the ones obtained with the voice dataset. These results suggest that independently of the pitch detection used, our separation approach can better handle instrumental signals than vocal ones. However, it should also be noted that larger confidence intervals are also obtained for the instrument dataset, suggesting that some instruments are better handled than others. It is particularly noticeable that Alg2 consistently results in higher APS and TPS scores, sometimes even higher than the ones obtained with Prior. These results might seem surprising, but careful analysis of the extracted audio tracks show that Alg2 somehow benefits longer and more continuous pitch contours [33]. This allows the spectral estimation to better characterize each of the tones and to capture more accurately their attacks and releases. This comes at the cost of slightly lower IPS scores for the solo. As already mentioned in Subsection 4.2, our proposed method, and thus Alg1, might be too strict in the discrimination of the time-frequency information assigned to the solo and this becomes clear with the perceptual scores with low APS and TPS scores. Finally, resulting signals have also shown that Alg2 can discriminate more accurately voiced from unvoiced segments in the tracks, but octave errors occur more often.
4.2.4 Algorithm performance and state-of-the-art approaches
The performance of our proposed algorithm was compared to state-of-the-art approaches under the Signal Separation Evaluation Campaign (SiSEC 2013) in the Professionally Produced Music Recordings task. The pitch detection method used for this evaluation was Alg1.
A total of 15 algorithms were submitted and evaluated under a common dataset. The full table of results and algorithm details can be found at the campaign’s website [36]. It has to be noted that the dataset used in this campaign is entirely composed of commercial vocal tracks, and no instrumental solos are used in the evaluation. In Table 1, the results obtained with our proposed method and with three other algorithms designed for separation of solo instruments (or specifically singing voice) from music accompaniment are presented for reference. The results from vocal extraction on the test datasets are presented.
The algorithm Marxer1 is a low-latency main instrument separation approach for stereo mixtures presented in [5] and described in Section 3. The authors report that the algorithm allows real-time performance. The method uses a probabilistic pitch extraction approach in conjunction with panning masks to perform separation. The algorithm Marxer2 is presented in [37], and it is an NMF-based approach which extends the work of [8] to specifically address the problem of singing voice extraction and fricative modeling in the separation scheme. The authors report a performance time of approximately three times the length of the audio segment. Finally, the REPET algorithm presented in [4] takes advantage of the repetitive structure of most commercial songs to separate singing voice from music accompaniment. The authors report processing times of 0.04 s for 1 s of audio on a 3.4-GHz computer.
Our proposed method has a processing time of 0.25 s for 1 s of audio on a 2.6-GHz computer, allowing real-time processing. As previously explained, our algorithm separates solo instruments from their music accompaniment on monaural (single-channel) mixtures without making any assumptions of the type of solo instrument to be separated. Furthermore, our approach only uses spectral information from the previous time frames of the tone to perform separation. This minimizes memory usage as the only spectral information saved in memory is the one that corresponds to the current tone. Additionally, processing is efficient as spectrogram calculations are only performed on a tone by tone basis, avoiding large matrix operations which can be computationally demanding. Our algorithm obtained comparable OPS scores to the other approaches described, exhibiting particularly high IPS scores at the expense of lower APT and TPS scores.
4.3 Algorithm variations and performance analysis
In [38], we presented a study that evaluates the performance of our proposed method when processing parameters of the algorithm are slightly modified, but its main processing chain remains unchanged. The main goals of this study were on the one hand, to get a better understanding of the behavior and performance of the algorithm under different conditions, and on the other hand, to find ways of maximizing perceptual quality of separated solo and backing tracks under our current approach. Here, we extend this evaluation to include our currently larger dataset, an alternative weighting approach for harmonic amplitude envelopes, and a second pitch detection front end (Alg2 described in Subsubsection 4.2.3). The main goal behind this analysis is to clearly understand the effects of each of the algorithm modifications on the quality of separated tracks. We focus not only on the general perceptual quality (OPS) but also on the effects on each of the distortions measures (APS, IPS, TPS). This analysis becomes very relevant when separation algorithms need to be optimized to meet the quality requirements of a certain application. If we assume for example that for automatic music transcription, interferences from other sources should be minimized to obtain better results, then the algorithm variation which maximizes the IPS score is the most suitable one for such an application. Our goal is to conduct such an analysis for the particular case of music education applications. In this section, the effects of the algorithm variations are analyzed. In Section 5, the use of separation technologies in music education is addressed.
The following four algorithm versions are considered and evaluated with the two pitch detection front-ends:
-
(a)
Proposed algorithm: as presented in Section 4.
-
(b)
Data-driven CAM: even though amplitude envelopes of musical instruments have proven to be difficult to model, different harmonics of the same source exhibit similar amplitude envelopes and can be, in many cases, highly correlated. This is known as CAM, and it is an important cue in human auditory perception [39]. Being CAM an observed characteristic in musical instrument spectra, some separation approaches have attempted to include CAM in their processing chains. In [15] for example, CAM is used as a mean to resolve overlapped harmonic components in a least squares estimation framework. In [40], the authors propose a spectro-temporal modeling of harmonic magnitudes and test their method on isolated instrument notes. They also test their estimation algorithm in the separation context by creating random mixes of a maximum of six instrumental tones.
To impose CAM in the estimation of solo signals, it is necessary to first obtain a reference temporal envelope that all the harmonic components of the tone should follow. However, as opposed to [15] and [40] where prior knowledge of the f 0s of all the sources allowed the differentiation between clean and overlapped envelopes, this prior information is not available in our proposed method. In our solo/accompaniment separation context, determining where harmonic components overlap is not plausible without having a good idea of the spectral content of the other sources. Similarly, extracting clean envelope information from at least one of the harmonics is not straightforward either as the presence of other sources is impossible to predict in our current approach. Consequently, we propose to use CAM in a different way. We introduce CAM into our system by estimating the partial magnitude envelope which is most similar to all other partial envelopes and use it as a reference to impose CAM in our spectral estimation. It works in the following way. (1) We first estimate the temporal magnitude envelopes of all partials as described in Subsubsection 4.1.3; (2) as estimation of lower partials is more robust than for higher ones, only the first pCAM partials are used at this stage. The goal is to find the partial among the first pCAM partials, whose temporal envelope has the highest mean cross-correlation with the other pCAM−1 envelopes. For this matter, we calculate the cross-correlation r i j between the temporal envelopes of the i th and j th partials for all i,j≤pCAM and i≠j. (3) We calculate the mean cross-correlation for each partial by averaging the pCAM−1 cross-correlation coefficients r i j obtained for each partial. The partial with the maximum mean cross-correlation is taken as the reference. That is, . (4) The temporal envelope of the reference partial is normalized to [0,1] and used as a weighting function for all the other partial envelopes. Even when only the first pCAM partials are used to obtain the reference envelope, the temporal envelopes of all partials p=1⋯pmax are weighted with the reference curve.
The effects of imposing CAM in the spectral estimation of a saxophone tone are shown in Figure 7. For visualization purposes, only the first five partials of the tone are shown. In Figure 7a, the estimated tone before CAM is displayed. In Figure 7b, the estimated tone after CAM is shown. Finally, in Figure 7c, the original tone taken from the original saxophone recording (ground-truth) is shown for reference. It can be seen that the use CAM results in temporal envelopes closer to the original ones. Particularly noticeable is its effect on the f 0 envelope (blue curve) where the estimation of the initial time frames of the tone are clearly affected by overlapping of spectral components of other sources. This causes the initial estimation to show considerable differences with the original tone. However, the use of CAM reduces the impact of initial misestimations and results in solo signals with reduced interference from other sources.
Figure 7 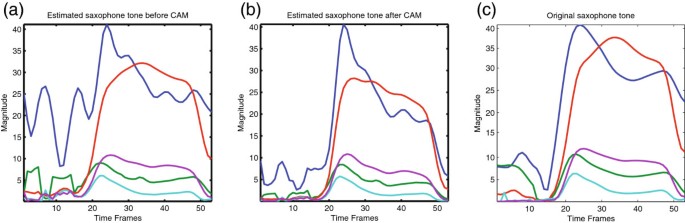
Effects of common amplitude modulation (CAM) on the estimation of a saxophone tone. The three plots show the temporal envelopes of the five first partials of the tone. (a) Initial estimation of the tone before CAM. (b) Estimated tone after CAM has been applied. (c) Original saxophone tone extracted from the original saxophone recording (ground-truth).
-
(c)
Wiener masking: the final masking stage described in Subsubsection 4.1.4 is replaced by a soft masking approach based on Wiener filtering. Additionally, range compression is applied to the magnitude spectrogram. In [29] and [41] for example, range compression has been applied as it resulted in better perceptual quality of separation. In this case, the spectral components are raised to the power of 0.3 as informal listening test showed that better separation quality was obtained than with a series of values tested between 0.3 and 2.
-
(d)
Noise spectrum: the spectral estimation stage in our proposed method models tone objects under the assumption that tones exhibit a harmonic behavior. However, it is clear that noise-like elements can also be present in tone objects, e.g., attacks in wind instruments, fricative sounds in voice signals, bow/string interaction in string instruments, mechanical interactions in instruments related to key and hammer movement. To model these events within our spectral estimation, a noise spectrum is included in every tone object. After all harmonic components of the tone have been determined as explained in Subsubsection 4.1.3, the included noise spectrum is limited to the frequency bins ranging from p=1 to p=p max. This is meant to minimize interference from other sources in the extracted solo. Similar approaches have also been used in [8].

Results for the four algorithm versions are presented in Figure 8 for solo and backing tracks independently. Mean values with 95% confidence intervals are presented. The following name conventions are used in the plots: Own1 and Own2 (and their short versions O1 and O2) refer to our proposed method using Alg1 and Alg2 as pitch detection front-ends, respectively. The subscripts ‘CAM’, ‘Wiener’, and ‘Noise’ are used for algorithm versions b, c, and d, respectively. For easier visualization, a vertical dotted line separates the results obtained with Alg1 and Alg2.

Objective perceptual quality measures for four algorithm versions and two pitch detection front-ends ( Alg1 , Alg2 ). Overall perceptual score (OPS), target-related perceptual score (TPS), interference-related perceptual score (IPS), artifact-related perceptual score (APS). The vertical dotted line divides results obtained with Alg1 and Alg2. (a) Solo results. (b) Backing results.
Results for the solo tracks show a considerable improvement in IPS scores when CAM is used in the spectral estimation stage. Furthermore, a clear inverse relationship can be observed between both TPS and APS scores, and IPS scores of the solo tracks: those algorithm versions that result in an increase of IPS for the solo, also result in a decrease in both TPS and APS scores. Similarly, those algorithm versions that bring an increase in TPS and APS for the solo, result in lower IPS scores. OPS for the solo are relatively constant for all algorithm version, and only minimum variations are observed. This is clearly due to the fact that for all the algorithm modifications presented, a benefit in a particular perceptual measure comes at the cost of a decrease in another perceptual score(s). The inclusion of a noise spectrum results in more homogeneous scores for the solo signals, with less differences between the different perceptual scores.
Results for the backing tracks considerably differ from the ones obtained for the solo tracks. In this case, the use of CAM results in decreased IPS and TPS scores and consequently in considerably lower OPS scores. However, a considerable improvement is observed in APS scores for the backing tracks when CAM is used. An inverse relationship is also observed, this time between TPS and IPS scores, and APS scores of the backing: increased APS scores always come with decreased TPS and IPS scores and vice versa.
Confirming our findings from the preliminary study presented in [38], results suggest that for our current approach, perceptual quality of solo and backing tracks is optimized differently. Modification that improve quality of solo tracks do not necessarily result in better backing tracks. This is in essence a simple concept but its use implies removing the additivity constraint that lies in the traditional definition of sound separation: retrieve the original sources from the mix which naturally implies that the mix can be exactly reconstructed from the extracted sources. When different parameters are applied to the different target sources, this hard constraint, |F(k,n)|=A(k,n)+S(k,n) in our case, can no longer be imposed and the magnitude spectrogram is better modeled as |F(k,n)|≈A(k,n)+S(k,n).
5 Sound separation for music education applications
As mentioned in the introductory sections, our goal is to study the usability of solo/accompaniment separation in music education and practice applications. In this section, we introduce the music education context and conduct tests to assess quality requirements for this specific field.
In most music practice scenarios, users learning a musical piece at home have limited options concerning available material that can make their learning process easier and more productive. Musicians either practice by themselves in the traditional way, or in some cases, play along to audio recordings of a musical piece [42]. In some cases, learning material in the form of commercial play along tracks might be available but content is often limited. In [43], we present a thorough overview of the use of MIR in music education and describe the types of practice material available. Among many of the MIR techniques that can be applied to music education, sound source separation represents a very powerful tool for creation of practice material from commercial music recordings of all types. The concept of backing tracks to play along to or the idea to develop a system for karaoke have been around for many years. Many studies have been made to assess the general technical challenges involved in the de-soloing task. However, the question that we wish to answer with this study is the following: which are the quality requirements expected from separation algorithms for them to be suited for music education and practice applications? It is common practice in separation research to assess the performance of separation approaches in terms of the types of signal distortions introduced by the algorithm, that is, target distortions, interference from other sources, and artifact distortions [34]. With this in mind, we wish to understand which types of signal distortions introduced by separation algorithms are acceptable in music education applications and get clear directions on how to optimize our algorithm for this matter.
To address these questions, we have developed and conducted a listening test procedure that brings music practice and separation research together. The characteristics of this test are presented in the following section.
5.1 Listening test procedure
A total of 12 subjects conducted the listening test which took place in the music practice room at Fraunhofer IDMT. The subjects were all intermediate to advanced musicians from 15 to 34 years old: 4 guitar players, 3 bass players, 3 piano players, 1 trumpet player, and 1 saxophonist. For each instrument, commercial multi-track recordings were used to create the test material. Due to copyright restrictions, this dataset cannot be made publicly available.
The subjects were asked to perform a short piece of music featuring their musical instrument. With the goal of making the subjects as comfortable as possible and as close to a real practice session as possible, a musical score, a piano-roll view, and tablature for guitar and bass were made available for them to choose their preferred option. The Songs2See Game interface [19] was used for this matter. All the audio material was played through a pair of AKG K701 semi-open headphones, and the subjects were allowed to modify both the playback level of the tracks and of their instruments to their own personal taste. The choice of headphones over speakers was made based on the fact that in real practice scenarios, the most commonly used playback devices are portable audio players, tablets, and cell phones in combination with a pair of headphones. The order in which the signals were presented to each user in the two sections of the test was randomized. The users were asked to rate how comfortable they felt practicing the musical piece with each of the different signal versions.
The listening test consisted of a training phase and an evaluation phase. During the training phase, the users were given a short introduction to the listening tests, its goals, and evaluation procedure. Furthermore, the users were presented with test material (example signals from the listening test) so they could make themselves familiar with the types of signals and distortions in the evaluation.
The evaluation stage was composed of two sections: (1) solo track evaluation and (2) backing track evaluation. In the two evaluation sections, subjects were presented with four different versions of solo and backing tracks, as well as the original recording (mix). Three signal versions (v1, v2, v3) where created so that each one specifically described one of the signal distortions (interference, artifacts, target). The fourth version (v4) was obtained with our proposed separation algorithm. The original recording (mix) was always used as a comparison, as in most music practice scenarios, this track is the only one available to the users. To create versions 1, 2, and 3, a similar approach as the one proposed in [34] was taken:
-
1.
Artifacts: this version was obtained as the sum of the original target signal and an artifacts signal. The artifacts signal was created by randomly taking 1% of the time-frequency coefficients of the target source (and thus setting 99% of the time-frequency coefficients to zero) and synthesizing this very sparse signal. The loudness of the artifacts signal was adjusted to that of the target. This artifacts signal is then added to the original target signal (clean) to artificially create a signal with artifact distortions. Randomly taking 1% of the time-frequency coefficients results in a very sparse time-frequency representation that sounds like clicks, breaks, and musical noise when re-synthesized.
-
2.
Target: this version was crated by low-pass filtering the original source signal to a 3.5-kHz cutoff frequency and by randomly setting 20% of the time-frequency coefficients to zero.
-
3.
Interference: this version was obtained as the sum of the original source signal and an interference signal. The interference signal in this case is the backing track, whose loudness was adjusted to that of the target.
In the first section of the test (solo track evaluation), the users were asked to practice the musical piece and play it as fluidly as possible with the aid of the solo track versions. In the second section of the test (backing track evaluation), the users were asked to play the given melody with the accompaniment of the backing tracks (as resembling a real musical scenario). The subjects were then asked to evaluate the provided backing tracks. All ratings in the listening test that were performed in a continuous scale from 0 to 100 were additional descriptive hints and were given as follows: Bad (0 to 20), Poor (20 to 40), Fair (40 to 60), Good (60 to 80), and Excellent (80 to 100) [44]. Users were also allowed to submit any comments that they found relevant about their experience in the listening test.
5.2 Listening test results
The results of the listening tests are presented in Figure 9a. As recommended in [44], mean values with 95% confidence intervals are presented for the original recording (mix) and the four signal versions (interference, artifacts, target, own). Results for the solo signals are presented in the left pane of the figure and results for the backing on the right.

Listening tests results. (a) Signal distortions, (left) solo tracks, (right) backing tracks. Mean values with 95% confidence intervals are shown. Ratings for the original recording (mix), signals obtained with the proposed algorithm (own), interference signal (Interference), artifacts signal (Artifacts), and target signal (Target) are presented. (b) Mixture/separation preference.
For both the solo and accompaniment tracks, the highest mean scores were obtained by the interference signal, being the mean values in both cases, very close to the ones obtained by the mix. This evidences the importance of preserving the signal’s quality with a minimum of introduced artifacts, regardless of the fact that traces of the other source are still present. Mean values for the solo show that users find the artifacts signal most disturbing during practice time. Subjects’ comments after the listening test emphasized the fact that artifacts are distracting and make it more difficult to keep the rhythm. For the backing tracks, target distortions are most disturbing. The importance of a clear bass to follow was mentioned by the users and due to the somehow smoothed (low-pass filtered) target versions, onsets and bass notes were no longer so clear. The solo tracks obtained with the proposed algorithm received the lowest mean values with a fairly large variance between users. A possible explanation for such a large variation might be that different musical instruments pose different quality requirements for the solo signal. One can imagine for example, that a bass and a trumpet player might look for different signal characteristics. However, no final conclusions in this sense can be drawn with a sample size of this kind, and further experiments need to be conducted in that direction. The backing tracks extracted with the proposed algorithm, on the other hand, obtained mean values superior to the target and artifacts signals.The high mean values obtained for the reference mix might be due to the user’s familiarity with original recordings, as in most cases, this is the only version available to them. To confirm this hypothesis, we conducted an additional listening test where subjects were asked to compare the original mix with the original solo and accompaniment tracks (obtained from the multi-track recordings) while playing their musical instruments. Using original tracks removes the ‘quality’ element from the evaluation as all the signals are high-quality original recordings. This is of course a hypothetical scenario that tries to asses the usability of solo and accompaniment tracks in music education applications given that very high-quality separation can be achieved. For this listening test, the same laboratory setup was used as in the first one. However, in this case, no independent evaluation was made for the solo and backing tracks. Subjects were allowed to play with either the solo, the backing, or with a mixture of the two. The mixer options within the Songs2See Game were used to allow subjects to get the desired balance between the tracks. Having the option to freely mix the solo and backing tracks is a functionality that is available to the users when sound separation is performed. In Figure 10, the Songs2See game interface with its mixer options are displayed.

Songs2See Game interface. The mixer menu where subjects can modify the solo/backing track balance is displayed.
A total of 10 subjects conducted this test. The subjects were all beginner to advanced musicians between 27 and 34 years old: 3 bass players, 1 trumpet player, 3 guitar players, 2 piano players, and 1 saxophonist. Results from the listening test are displayed in Figure 9b. Mean values with 95% confidence intervals are presented. Results clearly show that subjects prefer having the possibility of playing with separated tracks than with the original mix. Performing separation allows users to control the playback levels depending on their skills and preferences: completely mute the solo, add a little of the solo to the backing track for reference, or re-mix the tracks again to get the mix. The separated tracks obtained a mean value of 95.22 and a confidence interval of only 3.3. The mixture obtained a mean value of 62.88 with a slightly large confidence interval of 14.87. This listening test confirms the somehow expected results that the use of sound separation in music education applications brings beneficial functionalities for the practice sessions. This results are also supported by the great availability of music education practice literature, where solo and backing tracks (specially recorded for this purpose) are available. See [43] for a thorough overview of music education material.
6 Conclusions
In this work, we propose an efficient method for pitch-informed solo/accompaniment separation based on a tone-based estimation of the solo instrument and a post-processing stage that addresses transient-like interferences in the solo signals, attack sections, and the use of CAM in the estimation of the harmonic components of a tone.
We designed and conducted a listening test procedure to evaluate the plausibility of using such separation techniques within a music education context. Results from the listening test revealed that quality requirements for the solo and backing tracks are different, and such differences should be considered if a separation method is to be optimized for this particular application.
Two pitch detection front-ends as well as different algorithm modifications were evaluated with the goal of getting a better understanding of their impact in the perceptual quality of separated tracks. As evidenced in the listening test results, higher APS and TPS scores for the solo is a desired outcome if we aim at optimizing our method for its use in music education applications. Similarly, results from the listening test also showed that minimizing interference from other sources in the solo signal does not play a major role. With this in mind, Alg2 as a pitch detection front-end slightly benefits quality requirements of music education applications. The use of CAM has shown an important improvement of the APS score of the backing track which is a desirable outcome if the separation algorithm is optimized for music education applications. Similarly, the use of noise spectrum for the solo track shows an improvement in TPS and APS scores which is also a desired outcome for music education applications.
Future research directions include further evaluation of the differences in spectral characteristics and quality requirements of different musical instruments and the voice and better characterization of musical instrument tones both in time and frequency within the separation approach.
References
Salamon J, Gómez E: Melody extraction from polyphonic music signals using pitch contour characteristics. IEEE Trans. Audio Speech Lang. Process 2012, 20(6):1759-1770.
Liutkus A, Durrieu JL, Daudet L, Richard G: An overview of informed audio source separation. In 14th International Workshop on Image and Audio Analysis for Multimedia Interactive Services (WIAMIS 2013):3–5July 2013. Paris; 3-6.
Huang PS, Chen SD, Smaragdis P, Hasegawa-Johnson M: Singing-voice separation from monaural recordings using robust principal component analysis. In IEEE International Conference on Acoustics, Speech, and Signal Processing (ICASSP 2012): 25-30 March 2012. Kyoto; 57-60.
Rafii Z, Pardo B: REpeating Pattern Extraction Technique (REPET): a simple method for music/voice separation. IEEE Trans. Audio Speech Lang. Process 2013, 21: 73-84.
Marxer R, Janer J, Bonada J: Low-latency instrument separation in polyphonic audio using timbre models. In Latent Variable Analysis and Signal Separation, Volume 7191. Edited by: Theis F, Cichocki A, Yeredor A, Zibulevsky M. Springer, Heidelberg; 2012:314-321.
Duong NQK, Vincent E, Gribonval R: Under-determined reverberant audio source separation using a full-rank spatial covariance model. IEEE Trans. Audio Speech Lang. Process 2010, 18(7):1830-1840.
Liutkus A, Ozerov A, Badeau R, Richard G: Spatial coding-based informed source separation. In 20th European Signal Processing Conference (EUSIPCO 2012): 27-31 August 2012. Bucharest; 2407-2411.
Durrieu JL, David B, Richard G: A musically motivated mid-level representation for pitch estimation and musical audio source separation. IEEE J. Selected Topics Signal Process 2011, 5(6):1180-1191.
Ewert S, Müller M, Grosche P: High resolution audio synchronization using chroma onset features. In IEEE International Conference on Acoustics, Speech, and Signal Processing (ICASSP 2009): April 19-24, 2009. Taipei; 1869-1872.
Ganseman J, Scheunders P, Mysore GJ, Abel JS: Evaluation of a score-informed source separation system. In 11th International Society for Music Information Retrieval Conference (ISMIR 2010). Utrecht, Netherlands; August 9–13, 2010.
Bosch JJ, Kondo K, Marxer R, Janer J: Score-informed and timbre independent lead instrument separation in real-world scenarios. In 20th European Signal Processing Conference (EUSIPCO 2012), Volume 25. Bucharest, Romania; 27-31 August 2012:2417-2421.
Fritsch J, Plumbley MD: Score informed audio source separation using constrained nonnegative matrix factorization and score synthesis. In IEEE International Conference on Acoustics, Speech, and Signal Processing (ICASSP 2013). Vancouver, Canada; 26-31 May 2013:888-891.
Duan Z, Pardo B: Soundprism : an online system for score-informed source separation of music audio. IEEE J. Selected Topics Signal Process 2011, 5(6):1205-1215.
Ewert S, Müller M: Score-informed source separation for music signals. In Multimodal Music Processing, Volume 3. Edited by: Müller M, Goto M, Schedl M. Dagstuhl Publishing, Schloss Dagstuhl; 2012:73-94.
Li Y, Woodruff J, Wang D: Monaural musical sound separation based on pitch and common amplitude modulation. IEEE Trans. Acoustics Speech Signal Process 2009, 17(7):1361-1371.
Klapuri AP: Multiple fundamental frequency estimation based on harmonicity and spectral smoothness. IEEE Trans. Speech Audio Process 2003, 11(6):804-816. 10.1109/TSA.2003.815516
Durrieu JL, Thiran J-P: Musical audio source separation based on user-selected F0 track. In Latent Variable Analysis and Signal Separation, Volume 7191. Edited by: Theis F, Cichocki A, Yeredor A, Zibulevsky M. Springer, Heidelberg; 2012:438-445.
FitzGerald D: User assisted separation using tensor factorisations. In 20th European Signal Processing Conference (EUSIPCO 2012). Bucharest, Romania; 27-31 August 2012:2412-2416.
Cano E, Dittmar C, Grollmisch S: Songs2See: learn to play by playing. In 12th International Society for Music Information Retrieval Conference (ISMIR 2011). Miami, USA; 24-28 October 2011.
Fuentes B, Badeau R, Richard G: Blind harmonic adaptive decomposition applied to supervised source separation. In 20th European Signal Processing Conference (EUSIPCO 2012). Bucharest, Romania; 27-31 August 2012:2654-2658.
FitzGerald D, Cranitch M, Coyle E: Extended nonnegative tensor factorisation models for musical sound source separation. Comput. Intell. Neurosci 2008, 2008(2):1-15.
Simsekli U, Cemgil AT: Score guided musical source separation using generalized coupled tensor factorization. In 20th European Signal Processing Conference (EUSIPCO 2012). Bucharest, Romania; 27-31 August 2012:2639-2643.
Gerber T, Dutasta M, Girin L, Févotte C: Professionally-produced music separation guided by covers. In 13th International Society for Music Information Retrieval Conference (ISMIR 2012). Porto, Portugal; 8-12 October 2012:85-90.
Smaragdis P, Mysore GJ: Separation by humming : user-guided sound extraction from monophonic mixtures. In 2009 IEEE Workshop on Applications of Signal Processing to Audio and Acoustics (WASPAA 2009). New Paltz, NY; 18-21 October 2009.
Leveau P, Maller S, Burred JJ, Juareguiberry X: Convolutive common audio signal extraction. In 2011 IEEE Workshop on Applications of Signal Processing to Audio and Acoustics (WASPAA 2011). New Paltz, NY; 16-19 October 2011:165-168.
Dressler K: Pitch estimation by the pair-wise evaluation of spectral peaks. In AES 42nd International Conference on Semantic Audio. Ilmenau, Germany; 22-24 July 2011:1-10.
Cano E, Cheng C: Melody line detection and source separation in classical saxophone recordings. In 12th International Conference on Digital Audio Effects (1-4 September DAFx-09). Como, Italy; 2009:1-6.
Fletcher NH, Rossing TD: The Physics of Musical Instruments, 2nd edition. Springer, New York; 1998.
Ono N, Miyamoto K, Roux JL: Separation of a monaural audio signal into harmonic/percussive components by complementary diffusion on spectrogram. In 16th European Signal Processing Conference (EUSIPCO 2008). Lausanne, Switzerland; 25-28 August 2008:1-4.
SiSEC: SiSEC Dataset. 2010.http://sisec.wiki.irisa.fr/tiki-index.php?page=Professionally%20produced%20music%20recordings . Accessed 10 Jan 2013
Fritsch J: TRIOS Dataset. 2012.http://c4dm.eecs.qmul.ac.uk/rdr/handle/123456789/27 . Accessed 20 Feb 2013
CCMixter: CCMixter. 2013.http://dig.ccmixter.org/ . Accessed 12 Feb 2013
Cano E: Solo and accompaniment separation results. 2013.http://www.idmt.fraunhofer.de/en/Departments_and_Groups/smt/solo_and_accompaniment_separation.html . Accessed 12 June 2013
Emiya V, Vincent E, Harlander N, Hohmann V: Subjective and objective quality assessment of audio source separation. IEEE Trans. Audio Speech Lang. Process 2011, 19(7):2046-2057.
Centre for Digital Music QMU: Sonic Visualiser. 2013.http://www.sonicvisualiser.org/ . Accessed 10 May 2013
SiSEC: SiSEC 2013 Results. 2011.http://www.onn.nii.ac.jp/sisec13/evaluation_result/MUS/testMUS2013.htm . Accessed 01 Oct 2013
Janer J, Marxer R: Separation of unvoiced fricatives in singing voice mixtures with music semi-supervised NMF. In 16th International Conference on Digital Audio Effects (DAFx-13). Maynooth, Ireland;2–5September 2013:1-4.
Cano E, Dittmar C, Schuller G: Re-thinking sound separation: prior information and additivity constraint in separation algorithms. In 16th International Conference on Digital Audio Effects (DAFx-13). Maynooth, Ireland;2–5September 2013:1-7.
Bregman AS: Auditory Scene Analysis. The MIT Press, Cambridge; 1990.
Gunawan D, Sen D: Separation of harmonic musical instrument notes using spectro-temporal modeling of harmonic magnitudes and spectrogram inversion with phase optimization. J. Audio Eng. Soc (AES) 2012., 60(12):
Fitzgerald D: Harmonic/percussive separation using median filtering. In 13th International Conference on Digital Audio Effects (DAFx-10). 1, Graz, Austria; 6-10 September 2010:10-13.
Stowell D, Dixon S: MIR in school? Lessons from ethnographic observation of secondary school music classes. In 12th International Society for Music Information Retrieval Conference (ISMIR 2011). Miami, USA; 24-28 October 2011.
Dittmar C, Cano E, Abesser J, Grollmisch S: Music information retrieval meets music education. In Multimodal Music Processing, Volume 3. Edited by: Müller M, Goto M, Schedl M. Dagstuhl Publishing; 2012:95-120.
ITU: RECOMMENDATION ITU-R BS. 1534-1 method for the subjective assessment of intermediate quality level of coding systems. Tech. rep. (2003)
Author information
Authors and Affiliations
Corresponding author
Additional information
Competing interests
The authors declare that they have no competing interests.
Authors’ original submitted files for images
Below are the links to the authors’ original submitted files for images.
Rights and permissions
Open Access This article is distributed under the terms of the Creative Commons Attribution 2.0 International License (https://creativecommons.org/licenses/by/2.0), which permits unrestricted use, distribution, and reproduction in any medium, provided the original work is properly cited.
About this article
Cite this article
Cano, E., Schuller, G. & Dittmar, C. Pitch-informed solo and accompaniment separation towards its use in music education applications. EURASIP J. Adv. Signal Process. 2014, 23 (2014). https://doi.org/10.1186/1687-6180-2014-23
Received:
Accepted:
Published:
DOI: https://doi.org/10.1186/1687-6180-2014-23