- Research
- Open access
- Published:
RETRACTED ARTICLE: A comparative study of different acceleration sensors in measuring energy consumption of human martial arts
EURASIP Journal on Advances in Signal Processing volume 2021, Article number: 110 (2021)
Abstract
At present, there are many acceleration sensors for measuring human martial arts in the market. However, due to the inaccurate measurement of some acceleration sensors, people who love martial arts are deeply troubled and unable to find an excellent acceleration sensor specifically for energy consumption detection of human martial arts. The development of this sensor is imminent, which is of great significance for the comparative study of energy consumption measurement of human martial arts in our country. In this study, 160 students aged 11–14 years were selected, and the subjects were divided into normal body mass group and abnormal body mass group. Of the 96 male adolescents, 32 were obese body mass, which was determined as male abnormal body mass Group; 64 male adolescents were normal body weight and male normal body weight group; female 64 adolescents were normal body weight and set as female normal body mass group. Using a built-in accelerometer and a mobile phone three-dimensional accelerometer, the subjects were subjected to a 3–8 km/h human martial arts exercise load test (each speed is continuously performed for 5 min). The two acceleration sensors collectively assess the accuracy of the prediction of the use of force in human martial arts experiments. The average power consumption of human art exercises uses a frequency of 60 times/min, 90 times/min and 120 times/min compared to two acceleration sensors. Test results show that the data points for the mobile accelerator eraser are scattered, and the distance between the data varies. The data points of the three-dimensional acceleration sensor are more concentrated and present a certain trend. The use of three-dimensional acceleration sensors to measure martial arts can fully reflect the energy consumption of human activities, and achieve an energy consumption measurement accuracy of more than 94%.
1 Introduction
As we all know, human martial arts is an irregular sport, so this kind of sports software cannot evaluate the energy consumption of fitness martial arts sports. The sensory-based motion of the accelerated motion primarily records the data of the three parts of the human body to connect system X, Y, and Z, and calculates the amount of energy consumption by the formula. However, the reliability and legitimacy of such sports software that simulates martial arts is not guaranteed, and home research in this field is slow. For this reason, it is necessary to carry out relevant research, and it is necessary to select an acceleration sensor specifically used to measure the energy consumption of human martial arts, which provides a more convenient measurement method for young basketball enthusiasts.
Due to the importance of acceleration sensor research, many research teams have begun to study acceleration sensors and have achieved good results. For example, David proposed a reliable data collection system for unstable speed sensors. The asynchronous cache line resets the data to ensure that the data frequency is maintained at about 20 HZ to adapt to unstable phones with instant built-in Android sensors and differences between different models [1]. Ruth McCullagh proposed a sliding window splitting method that combines the number of sampling points and the time span in dealing with acceleration time series to ensure the unity of the motion state in a single window; Influence, a feature selection method based on gravity acceleration decomposition is proposed, which makes the recognition accuracy of motion state reach more than 94.2% [2].
In the study of measuring the energy consumption of human sports, the use of acceleration sensors for measurement is a good method, which can solve many problems. Therefore, it is widely used in the research of measuring the energy consumption of human sports. It provides the energy supply and energy consumption of the athlete's energy supply system, summarizes the energy consumption characteristics of specific technical exercises for college table tennis players, provides relevant data references for the formulation of table tennis enthusiasts' fitness exercises, and guides the coaches in training table tennis players Provide theoretical support [3].
This article uses two different acceleration sensors to test. The subject sits for 5 min, and then completes the human martial arts exercise test in 60 min, 90 min and 120 min, respectively; the next test for the test in the modeling group, the subjects sit for 5 min and then perform a 5-min basketball test in a 1 × 1 m2. Filter, detrend and synthesize the original signal through Matlab7.0 software; with the measured value of K4b2 energy consumption as the dependent variable, all three frequencies belong to high-intensity exercise. There are significant differences between the energy consumption of boys and girls at the three basketball frequencies; the energy consumption prediction used by the acceleration sensor in this study and the actual measured energy consumption of the school calibration show good consistency, indicating that the three-dimensional acceleration. The sensor can make a good prediction of the energy consumption of human martial arts, and the accuracy can reach more than 94%. It can be used as a supplementary device to guide and intervene in college basketball.
2 Proposed method
2.1 Three-dimensional acceleration sensor measures human martial arts
When heart rate, pedometer and three-dimensional accelerometer are used alone to measure human energy use, the three-dimensional accelerometer method is the best option. However, the energy consumption value of the heart rate monitoring and the three-dimensional accelerometer in the free activity state is 30% higher than the energy intake [4]. The three-position acceleration sensor is shown in Fig. 1.

Legend of 3D acceleration sensor
-
(1)
Technical index of acceleration sensor
Piezoelectric acceleration sensors are widely used due to their wide frequency response, wide range of power, high reliability, and ease of use. In terms of standard vibration rate, the main technical indicators of the user are: analog output vs digital output, sensitivity, number of measurement axes, maximum measurement value, frequency and bandwidth, internal configuration, etc.
-
1)
Sensitivity
In order to allow users to easily select appropriate products when selecting acceleration sensors with different sensitivities, manufacturers generally give sensor sensitivity and reference range ranges in product introductions or manuals.
The minimum acceleration measurement value is also called the minimum resolution. Considering the noise problem of the post-amplifier circuit, it should be far away from the minimum available value.
The maximum measurement limit must consider the nonlinear effect of the acceleration sensor itself and the maximum output voltage of the subsequent instrument. Estimation method: maximum measured acceleration, sensor charge (voltage) sensitivity, whether its value exceeds the maximum input charge (voltage) value of the supporting instrument [5, 6].
-
2)
Number of measuring axes
The current acceleration sensors have one-dimensional, two-dimensional and three-dimensional. Many projects can basically meet the application with one-dimensional and two-dimensional, but for some special applications (such as UAV control), the three-axis acceleration sensor shows its advantages.
-
3)
Maximum measured value
The current measurement range of the acceleration sensor mainly includes 1.59, 29, 4 g and 6 g. The size and sensitivity of the range are inversely proportional. Considering that different occasions have different requirements for the range and sensitivity, you need to choose carefully.
If you want to measure the inclination of the robot with respect to the ground, then a ± 1.59 acceleration sensor is enough. But if you want to measure the dynamic performance of the robot, you need to use a sensor of 2 g. When considering the situation where the robot suddenly starts or stops such a large acceleration, it is necessary to choose a sensor of 5 g [7].
-
4)
Frequency and bandwidth selection
The different installation methods of the acceleration sensor will also change the use frequency response (it has little effect on the vibration value). The installation surface should be flat and smooth, and the installation selection should be based on the principles of convenience and safety. We offer a variety of different ways to install the same HKglol accelerator sensor: a strong integrated connection (± 10% error) of Hz; epoxy glue or “502” 6 kHz glue inserts; installation of a ZkHz magnetic handle; dual-core attachment IkHz. It can be seen that the different installation methods have a great influence on the response of the test frequency and should be selected carefully. The quality and sensitivity of the accelerometer are inversely proportional to the frequency of use. The sensitivity is high, the mass is high, and the frequency of use is low. This is also a selection technique [8, 9].
-
(2)
Hardware structure of three-dimensional acceleration monitoring system
The system mainly monitors the human body's motion acceleration. It mainly introduces the hardware structure and related core chips of the acceleration monitoring system. The acceleration monitoring system is mainly composed of a three-dimensional acceleration sensor that detects body acceleration, a storage chip that stores data, a microprocessor that processes data, a filter circuit, and a signal transmission circuit. The system framework and signal flow are shown in Fig. 2.
Fig. 2 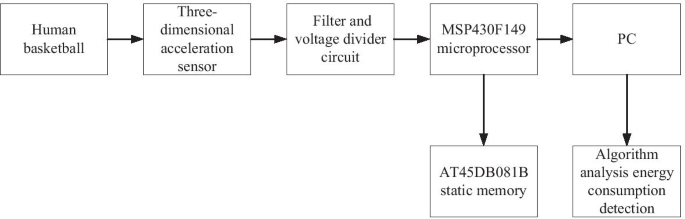
System framework and signal flow
It can be seen from Fig. 2. The system detects a human body signal with a three-dimensional acceleration sensor MMA7260. The signal enters the microprocessor MsP43oF149 through the filter mode. The analog signal is converted to a digital signal by the MsP43oF149 knife D converter, and after further processing, it is sent to the final AT45DB081 standing memory [10, 11]. The data is sent to the PC through RS232 for data processing and algorithm analysis, and then the human motion energy and body state are obtained [12, 13]. To facilitate data collection, the system uses two power supply modes: button battery and DC power supply. Button battery can be used to collect data for offline use.

2.2 The built-in acceleration sensor of the mobile phone measures human martial arts
GPS-based mobile sports energy consumption software uses GPS as a module to record the movement distance, exercise time, and then calculate data such as average speed, maximum speed, and energy consumption; it can be seen that energy consumption is based on the distance. The above is a core data [14].
-
(1)
Motion software of the built-in acceleration sensor of the mobile phone
This type of software mainly uses the three X, Y, and Z axis of the human body to connect the system to detect the acceleration of a cell at a certain time or in a certain way, and then use certain formulas. Such software can monitor and identify external games effectively, and can monitor sports effectively. It is worth considering whether the use of such software in China can achieve the same results as abroad. Different calculation methods and smart phone built-in different acceleration sensors may cause uncertainties in the results [15, 16].
-
(2)
Smart phone
Use the Redmi smartphone as the test phone, the operating system is Android, the phone is equipped with a built-in three-axis acceleration sensor, the model is ACCELEROETER, the range is ± 2 g; the number of axes is 3 axes; the accuracy is 3.90E-4; the power is 0.13. This type of mobile phone is cheap and has low configuration, and the operating system is more common, which is extensible to the conclusion of this study [17, 18]. This study included software for real-time sensor data acquisition software, and the sample frequency of the Redmi phone is set to 75 Hz; in this way, acceleration data of three human axis can be recorded simultaneously, and the cell phone saves format by CSV format; after the test is complete, upload the original data to the computer and its variants, use the MATLAB7.0 program software to filter, process and process the original data, and store it in 60-s data format, and then use SPSS20.0 to analyze and process the subsequent synthesized data [19].
-
(3)
Test plan
Before the test starts, the tester will ask the subject if they have taken vigorous exercise the previous day and their physical health; the next step is to fill in the basic information (name, gender, age, etc.) and measure the height, weight, and body composition. Then wear K4b2 and Redmi mobile phone at the same time, and fix the mobile phone with Armband special strap to the iliac spine on the right hip of the waist. The position was chosen because the upper and lower limb movement of the basketball is close to the center of mass of the human body. Before the start of the test, let participants practice and familiarize themselves with the whole process. They can also beat the basketball rhythm with normal sound. In the first step, pressing the Enter key for the portable K4b2 portable gas metabolism analyzer can not only keep time stable, but also ensure that the data can be compared between the portable K4b2 metabolic metabolism and Redmi phone. The time interval for device data extraction is 60 s [20, 21]. Finally, let the subjects be familiar with the relevant process adjustment and start the test. The test is divided into two parts, the test action is continuous feet and jumping, because this action is a type of fitness exercise commonly used by all ages. The first part is a fixed frequency test. The basketball frequency is divided into three levels, 30–60 times/min is low frequency, 61–120 times/min is medium frequency, and 121 times/min is high frequency. From the perspective of fitness, this study selected three (60 times/min, 90 times/min and 120 times/min) low and medium-level basketball frequency for comparative analysis, and recorded the test records of the subjects after completing the test The main content of the record is the subjective feelings and physical feelings of the three basketball sports frequencies, and then the basketball sports frequencies that are more in line with human sports characteristics and time-saving and high-efficiency are selected to facilitate the people to perform quantitative exercise in order to achieve more fitness effects Good timeliness. The second part is the test of the modeling group, and its data is mainly used to construct the prediction equation of energy consumption of human martial arts [22].
In the first part of the fixed frequency group test, the subject wears a device to sit for 5 min, and then completes 60 times/min, 90 times/min and 120 times/min basketball tests in a 1 × 1 m2. Frequency control uses audio controller. The test interval is indefinite. After the subject's meteor value per minute stabilizes below 3 METs, the next test can be performed. The number of exercises is counted by a tester, and the error of the basketball movement frequency per minute is controlled within ± 2 times, otherwise it is considered invalid. The test time for each frequency is 5 min, and the next 2 min of each frequency are selected for analysis [23].
In the second part of the test in the modeling group, the subject sat on the device for 5 min and performed a 5-min continuous step-and-step jump in a 1 × 1 m square, no limit to the number of interruptions; no limit to frequency. The test data is selected from the beginning to the end, and the data in the middle 3 min is selected for the establishment of the regression model. The data of the verification group verifies the regression model.
3 Experiments
3.1 Experimental subjects
In this study, 160 students in the 11–14 age group were selected. They are required to be in good health and have no symptoms such as cold and fever in the near future. And according to the “school-age children and adolescents overweight and obese BMI screening classification” standard. The subjects were divided into normal body mass group and abnormal body mass group. Among them, 32 out of 96 male adolescents are obese and are classified as male.
Normal body weight group; 64 male adolescents were normal body weight and male normal body weight group; female 64 adolescents were normal body weight and set as female normal body weight group.
3.2 Experimental procedure
-
(1)
Health survey
Each article completed a list of physical safety questions. There are usually seven questions, especially for people with coronary heart disease. Studies have shown that the specificity of the list of questions for obtaining improper exercise is close to 80%. It is mainly used for exercise load or before strenuous activities to reduce the risk of exercise. At the same time, staff will inform you of the topics of the entire assessment process.
-
(2)
Morphological index measurement
The experimenter records the basic situation of the subject and measures the body shape. Using the height and weight meter in the COMBI comprehensive fitness evaluation system of COMBI WELLNESS Co., Ltd. made in Japan, the subjects wear light clothing with no shoes and complete the measurement and weight. Height and weight are accurate at 0.01 m and 0.1 kg, respectively, as well as body mass index (BMI) calculation = weight/height. (3) Wear an Actiheart and a three-dimensional acceleration sensor.
Before wearing Actiheart and the three-dimensional acceleration sensor, you need to put electrode pads on the subject. According to the two different electrode placement options proposed by the manufacturer, we study the placement of the electrode pads of Actiheart and the three-dimensional acceleration sensor. On the sternum stem parallel to the four ribs, the position of the other electrode pad is located at the edge of the left pectoralis major muscle, which can be parallel to the main electrode pad. And fix Actiheart and three-dimensional acceleration sensor with tape to prevent its rotation from affecting the collected data.
The degree of skin cleansing has an important impact on the strength of the ECG signal, so the skin cleaning work before attaching the electrode pads is particularly important. We used the method of applying exfoliating cream to clean the skin of the subjects according to the requirements in the instrument manual jobs.
3.3 Statistics of data
Later data will be analyzed and processed using SPSS20.0 statistical software. The energy consumption of basketball sports at different frequencies is described in the format of ± S. The single-factor repeated measurement design is used to analyze the differences between the energy consumption of different sports frequencies. Repeated measurement design of factors to analyze the differences in energy consumption of boys and girls at different frequencies; using the measured value of K4b2 energy consumption as the dependent variable, and using a stepwise regression method to establish the mobile phone VM, age, height, weight, BMI, exercise times, interruptions, etc. Regression equation for independent variables. The paired t test was used to analyze the difference between the predicted value of the equation and the indirect calorimetry method, and the Pearson correlation analysis was used to analyze the relationship between the mobile phone VM and energy consumption; setting the P value below 0.05 was considered statistically significant. The consistency between the built-in acceleration sensor of the mobile phone and the K4B2 is detected using the Bland–Altman analysis chart, and the intra-group correlation analysis (ICC) is used to detect the consistency between the measured value and the predicted value of energy consumption.
Spherical test is often used to determine whether there is correlation between repeated measurement data. Since this study conducted three measurements of basketball sports energy consumption in a fixed frequency test, the obtained energy consumption data is repeated measurement data, so human martial arts. The energy consumption data for exercise is tested using a spherical test. The principle of the paired t test is to find the difference between the data. Its purpose can be inferred whether there are differences between the results of the two measurement methods, and the judgment index is the P value. The function of correlation analysis within the group is mainly used to test the consistency of the two results. The judgment standard is the Cronbach coefficient. The larger the coefficient, the greater the reliability. The greater the equality, the greater the credibility. The Bland–Altman method is a living combination of quantitative and quantitative analysis. The goal is to perform a randomized outcome analysis of the differences between the two tests to explain the inconsistency problem; its method is actually the difference between the two tests. Another observation is that the consistency of the Bland–Altman method test can be judged by a certain level of professional awareness, while taking into account structural and random errors, and there is a unique benefit function.
4 Discussion
4.1 The results of the 3 km/h test index of the built-in acceleration sensor and three-dimensional acceleration sensor
The measurement results of 3 km/h showed that the results of univariate analysis of variance in different age groups at different ages showed differences in the activity (P < 0.05) of male normal body weight group, and no other differences (P > 0.05). The average heart rate and total energy consumption of 3 km/h physical activity of 11–14-year-old male male normal body weight group were 108 ± 9.46 beats/min, 5.54 ± 3.29 kcal/min; the average heart rate of 11–14-year-old male normal body weight group and the total energy consumption was 111 ± 13.97 beats/min and 3.64 ± 2.64 kcal/min; the average heart rate and total energy consumption of the female normal body mass group 11–14 years old were 117 ± 13.71 beats/min and 2.47 ± 0.68 kcal/min. The trends of HR and total energy consumption of the three groups with age are not obvious. The experimental data is shown in Table 1.
As shown in Table 1, the number of activities and total energy use of the average weight group of men of the same age was higher than that of the average body weight of men; the average heart rate for women was higher than for normal men's weight, and the total cost of energy and energy unit of average weight was lower than that of normal men's body weight. The female normal body mass group's heart rate is higher than the male normal body weight group, while the total energy consumption and unit energy consumption of standardized body weight are lower than the male normal body weight group. Independent sample T test for male abnormal body mass group and male normal body mass group at the same age found: 12-year-old Activity (P < 0.01), 13-year-old Activity (P < 0.01), 14-year-old Activity (P < 0.05), total There are differences in energy consumption (P < 0.01), and there is no difference in other indicators (P > 0.05).
4.2 Research on energy consumption measured by different acceleration sensors (fixed frequency group)
In view of the large individual variation in the study, there may be a correlation between the data of different basketball sports beat frequencies of the same subject. If one-way analysis of variance is used, it will be difficult to identify the effective independent variables. Therefore, a single-factor repeated measurement design is used for comparative analysis. To check whether there is correlation between repeated measurement data, first use the spherical test to test the repeated measurement data. The significance of the spherical test is P = 0.244 > 0.05. The results are all subject to the spherical hypothesis, indicating that there is no correlation between the repeated measurement data. Experiment results are shown in Table 2.
As shown in Fig. 3, for the results of the two same acceleration sensors, the average energy consumption of basketball beat frequency of 60 times/min, 90 times/min, 120 times/min is 6.37 kcal/min, 8.98 kcal, respectively/min, 9.76 kcal/min; Mett value is 6.00METs/min, 8.03METs/min, 8.51METs/min. The design of a single recurring measurement of the power consumption of different basketball percussion waves indicates that the F power consumption value of the various basketball frequencies is 256.38, and the P value less than 0.05 has a significant difference. The one-size-fits-all design was made for shooting stars of various basketball games. The results showed that the F values of shooting stars in different basketball games were 197.141; P < 0.05 had a significant difference, with the results of the power analysis analysis of various basketball sports betting techniques (P < 0.01). The conclusion is that the results of the acceleration rate are basically the same.

Spherical test results of energy consumption (Kcal/min) and METs/min for different acceleration sensors
4.3 Design analysis and analysis of single factor repeated measurement of energy consumption and metope of basketball slapping frequency energy by different acceleration sensors
The average energy consumption of 60 times/min, 90 times/min, and 120 times/min for male students is 7.09 kcal/min, 10.14 kcal/min, and 10.89 kcal/min, respectively, 8.54 METs/min, 8.91 METs/min. The average energy consumption of female students at 60 times/min, 90 times/min, 120 times/min frequency is 5.65 kcal/min, 7.82 kcal/min, 8.64 kcal/min, respectively; Met is 5.76METs/min, 7.52METs/min, 8.12 METs/min; the experiment is shown in Fig. 4.

The results of a single-factor repeated measurement design analysis of energy consumption and Merlot measured by different sensors to measure the frequency of basketball jumps
As shown in Fig. 4, the overall trend of the three frequencies measured by the two acceleration sensors shows that both energy consumption and meteor increase with increasing frequency, especially at 60/min and 90/Min is more obvious, and the energy consumption value is always higher than the meteor value; but after 90 times/min, the upward trend of energy consumption and meteorology gradually slows down. It can be seen from the content of the topic discussion that the rhythm of the basketball rhythm of 90 beats/min is hard to grasp; a typical basketball rhythm of 60 beats/min is very slow and does not meet the signs of human movement; and basketball frequency of 120 min/min usually feels comfortable, Minor mistakes. The results of the study data also show that the level of physical activity is still very high.
4.4 Different acceleration sensors measure the energy consumption of boys and girls under different frequency of basketball in fixed frequency group
This study analyzes the analysis of the energy consumption and meteor of basketball sports of different genders by different acceleration sensors, in order to analyze the difference between the energy consumption and meteor of boys and girls. Choose the same number of men and women to ensure a balanced sample. The experimental results are shown in Fig. 5.

Different sensors measure the energy consumption of men and women at three basketball frequencies
As shown in Fig. 5, the average energy consumption of male students at 60, 90, and 120 frequency measurements is 7.09 kcal/min, 10.14 kcal/min, 10.89 kcal/min; Mett values are 6.25 METs/min, 8.54 METs/min, 8.91 METs/min. The average energy consumption of female students at 60 times/min, 90 times/min, 120 times/min frequency is 5.65 kcal/min, 7.82 kcal/min, 8.64 kcal/min, respectively; Metso is 5.76 METs/min, 7.52 METs/min, 8.12 METs/min.
4.5 Research on characteristics of mobile phone acceleration sensor and three-dimensional acceleration sensor
The mobile phone acceleration sensor records the activity data of the vertical axis of the human body, and the three-dimensional acceleration sensor collects the activity data of the three axes of the human body (ACx, ACy, ACz). In general, the mobile phone acceleration sensor and the three-dimensional acceleration sensor show a similar trend with the increase in the number of basketball slap movements. According to the observation, it can be seen that the three-dimensional acceleration sensor has a certain correlation with the basketball movement frequency, but the mobile phone acceleration. The trend of the frequency of the sensor and the basketball movement is not obvious, and the average difference between the counts (counts) is larger. The experimental results are shown in Fig. 6.

Comparative analysis of different acceleration sensor vectors on the frequency of basketball slapping
As shown in Fig. 6, it can be seen that the data points of the three-dimensional acceleration sensor are more concentrated and present a certain trend. Mobile data sensor data points are widely distributed, and the distance between data varies. This indicates that if you use a speed sensor to measure basketball, static axis data cannot be used to determine the result. Therefore, the sagittal axis and the frontal axis will inevitably not generate activity data. This may be one of the reasons why the mobile phone acceleration sensor cannot effectively measure basketball. The use of three-dimensional acceleration sensor to measure basketball can fully reflect the energy consumption of human activities. Energy consumption measurement accuracy is above 94%.
5 Conclusions
Compared with the operability and feasibility of basketball, football, badminton and other ball sports, martial arts is not restricted by the venue, and its fitness equipment is small and light, with strong operability and feasibility. From the perspective of the economy of exercise time and the benefits obtained, middle- and low-intensity martial arts exercise consumes more energy at the same time than daily sports activities such as jogging and walking and has a strong fitness function and promotion effect.
Through the content of the interview, I found that the duration of martial arts exercise is 90 min, and the rhythm of its frequency is more difficult to master. The human body's response to the ground is small, and the lower limbs have a long buffer time, which leads to an increase in energy consumption. The frequency of 120 times/min was tested. Those who believe that it conforms to the characteristics of human movement, the overall feeling is comfortable, the body's energy can be fully released, the frequency of errors can be kept stable, and the energy consumption can also be kept at a high level. From the perspective of fitness, many considerations are made in terms of fitness venues, fitness equipment, fitness time and fitness effects. It is believed that martial arts as a fitness method is feasible and operable; the frequency of fitness effects is more time-sensitive.
In this study, the data collected by the smartphone acceleration sensor and the three-dimensional acceleration sensor is the original signal, and the original signal needs to be filtered, corrected, and combined with counts, and then the energy consumption value is calculated through a specific equation model, so as to the estimated energy consumption value evaluates physical activity. The initial step of collecting data is the setting of the sampling frequency. The research results of WELK show that the body signal frequency of the acceleration signal in human movement is generally lower than 10 Hz, and the signal frequency of the body centroid in daily physical activity is 0.3–0.5 Hz. Under normal circumstances, the signal frequency of the body trunk of the human body should not be lower than 30 Hz. According to the current market, the sampling frequency of the built-in acceleration sensor and the three-dimensional acceleration sensor of the smartphone can basically reach 50 Hz, which can be used to monitor the energy consumption of basketball sports.
Availability of data and materials
Data sharing does not apply to this article because no data set was generated or analyzed during the current research period.
Change history
10 September 2022
This article has been retracted. Please see the Retraction Notice for more detail: https://doi.org/10.1186/s13634-022-00920-0
Abbreviations
- BMI:
-
Body mass index
- COMBI:
-
Combination
- ECG:
-
Electrocardiogram
References
D.R. Dall’Osto, P.H. Dahl, Using vector sensors to measure the complex acoustic intensity field. J. Acoust. Soc. Am. 138(3), 1767–1767 (2015)
R. McCullagh, N.M. Brady, C. Dillon, A review of the accuracy and utility of motion sensors to measure physical activity of frail older hospitalised patients. J. Aging Phys. Act. 24(3), 465 (2015)
R.D. Gurchiek, C.T. Pritchett, H. van Werkhoven, Using smartphone sensors to accurately measure ground reaction forces during physical activity - a feasibility study: 2819 board #342 June 3, 11: 00 AM–12: 30 PM. Med. Sci. Sports Exerc. 48(5 Suppl 1), 797 (2016)
J.D. Wood, J.A. Schanzle, E.A. Terray, Using low-cost inertial sensors to measure subsurface mooring motions IMU corrects upward-looking ADCP measurements. Sea Technol. 56(5), 39 (2015)
U. Maniscalco, R. Rizzo, A virtual layer of measure based on soft sensors. J. Ambient. Intell. Humaniz. Comput. 8(1), 1–10 (2016)
Q. Cheng, J. Juen, J. Hsulumetta et al., Predicting transitions in oxygen saturation using phone sensors. Telemed. J. E Health 22(2), 132 (2016)
P. Maijala, Z. Shuyang, T. Heittola, Environmental noise monitoring using source classification in sensors. Appl. Acoust. 129(1), 258–267 (2018)
J. Parak, M. Uuskoski, J. Machek, Estimating heart rate, energy expenditure, and physical performance with a wrist photoplethysmographic device during running. JMIR Mhealth Uhealth 5(7), 97 (2017)
M. Haege, Acoustic vector sensors: principles, applications, and practical experience. J. Acoust. Soc. Am. 138(3), 1767–1767 (2015)
A.A.R. Webb, K. Kuchitsu, J. Kwak, Sensors make sense of signaling. Plant Cell Physiol. 58(7), 1121–1125 (2017)
D. Doering, S. Amaryoucef, J. Baudot et al., CMOS-sensors for energy-resolved X-ray imaging. J. Instrum. 11(01), C01013 (2016)
C.M. Dumm, J.S. Vipperman, J.V. Carvajal, Thermoacoustic power sensors: principles and prediction. J. Acoust. Soc. Am. 140(4), 3002–3002 (2016)
W. Cui, W. Li et al., A novel method of multi-information acquisition for electromagnetic flow meters. Sensors 16(1), 25 (2015)
J. Fernandez de Canete, P. Del Saz-Orozco, R. Baratti, Soft-sensing estimation of plant effluent concentrations in a biological wastewater treatment plant using an optimal neural network. Expert Syst. Appl. 63(3), 8–19 (2016)
V.M. McClelland, The neurophysiology of paediatric movement disorders. Curr. Opin. Pediatr. 29(6), 1 (2017)
X. He, R. Qi, Y. Cheng, A wireless air flow sensor powered by a wind-induced vibration energy harvester. J. Vib. Eng. 30(2), 290–296 (2017)
S.S. Levy, K.J. Thralls, S.A. Kviatkovsky, Validity and reliability of a portable balance tracking system, BTrackS, in older adults. J. Geriatric Phys. Ther. 41(2), 1 (2016)
J.W. Brownscombe, S.J. Cooke, D.A. Algera, Ecology of exercise in wild fish: integrating concepts of individual physiological capacity, behavior, and fitness through diverse case studies. Integr. Comp. Biol. 57(2), 281 (2017)
L. Bedogni, M. Di Felice, L. Bononi, Context-aware android applications through transportation mode detection techniques. Wirel. Commun. Mob. Comput. 16(16), 2523–2541 (2016)
W. Xu, G. Lan, Q. Lin, S. Khalifa, M. Hassan, N. Bergmann, W. Hu, Keh-gait: using kinetic energy harvesting for gait-based user authentication systems. IEEE Trans. Mob. Comput. 18(1), 139–152 (2018)
Y.C. Du, C.L. Liu, D.F. Wu, Pavement roughness measurement method based on automobile mounted multiple sensors. China J. Highway Transport 28(6), 1–5 (2015)
G.V. Moreiras, J.M. Ávila, E. Ruiz, Energy balance, a new paradigm and methodological issues: the ANIBES study in Spain. Nutr. Hosp. 31(3), 101–112 (2015)
S. Mirzamohammadi, A.A. Sani, Viola: trustworthy sensor notifications for enhanced privacy on mobile systems. IEEE Trans. Mob. Comput. 17(11), 2689–2702 (2018)
Funding
This work was supported by Rural Sports Development Research Center of Fujian College Humanity and Social Sciences Research Base (Minnan normal University) (20NTKT010).
Author information
Authors and Affiliations
Contributions
QJ contributed to writing—editing, ZY contributed to data analysis, and YW contributed to sampling method. All authors read and approved the final manuscript.
Authors' information
Qixia Jia was born in Zhoukou, Henan, P.R. China, in 1986. He received the master's degree from Chengdu Sport University, P.R. China. Now, he works in the sports department of Chongqing Jiaotong University. His research interests include martial arts competitions and college physical education.
Zhenyin Yan was born in Xuchang, Henan, P.R. China, in 1988. He received the master’s degree from Aomen University, P.R. China. He works in the institute of physical Education, Chongqing University of Posts and telecommunications. His research interests include martial arts competitions and physical education.
Yongyong Wang was born Taiyuan, Shanxi, P.R. China, in 1989. He received the master's degree from Chengdu Sport University, P.R. China. Now, he works in the sports department of Chongqing Jiaotong University. His research interests include sports competition video analysis and college physical education.
Corresponding author
Ethics declarations
Ethics approval and consent to participate
This article is ethical, and this research has been agreed.
Consent for publication
The picture materials quoted in this article have no copyright requirements, and the source has been indicated.
Competing interests
The authors declare that they have no competing interests.
Additional information
Publisher's Note
Springer Nature remains neutral with regard to jurisdictional claims in published maps and institutional affiliations.
This article has been retracted. Please see the retraction notice for more detail: https://doi.org/10.1186/s13634-022-00920-0
Rights and permissions
Open Access This article is licensed under a Creative Commons Attribution 4.0 International License, which permits use, sharing, adaptation, distribution and reproduction in any medium or format, as long as you give appropriate credit to the original author(s) and the source, provide a link to the Creative Commons licence, and indicate if changes were made. The images or other third party material in this article are included in the article's Creative Commons licence, unless indicated otherwise in a credit line to the material. If material is not included in the article's Creative Commons licence and your intended use is not permitted by statutory regulation or exceeds the permitted use, you will need to obtain permission directly from the copyright holder. To view a copy of this licence, visit http://creativecommons.org/licenses/by/4.0/.
About this article

Cite this article
Jia, Q., Yan, Z. & Wang, Y. RETRACTED ARTICLE: A comparative study of different acceleration sensors in measuring energy consumption of human martial arts. EURASIP J. Adv. Signal Process. 2021, 110 (2021). https://doi.org/10.1186/s13634-021-00819-2
Received:
Accepted:
Published:
DOI: https://doi.org/10.1186/s13634-021-00819-2