- Research
- Open access
- Published:
Adaptive tracking of people and vehicles using mobile platforms
EURASIP Journal on Advances in Signal Processing volume 2016, Article number: 65 (2016)
Abstract
Tracking algorithms have important applications in detection of humans and vehicles for border security and other areas. For large-scale deployment of such algorithms, it is critical to provide methods for their cost- and energy-efficient realization. To this end, commodity mobile devices have significant potential for use as prototyping and testing platforms due to their low cost, widespread availability, and integration of advanced communications, sensing, and processing features. Prototypes developed on mobile platforms can be tested, fine-tuned, and demonstrated in the field and then provide reference implementations for application-specific disposable sensor node implementations that are targeted for deployment. In this paper, we develop a novel, adaptive tracking system that is optimized for energy-efficient, real-time operation on off-the-shelf mobile platforms. Our tracking system applies principles of dynamic data-driven application systems (DDDAS) to periodically monitor system operating characteristics and apply these measurements to dynamically adapt the specific classifier configurations that the system employs. Our resulting adaptive approach enables powerful optimization of trade-offs among energy consumption, real-time performance, and tracking accuracy based on time-varying changes in operational characteristics. Through experiments employing an Android-based tablet platform, we demonstrate the efficiency of our proposed tracking system design for multimode detection of human and vehicle targets.
1 Introduction
Distributed sensor networks for tracking the movement of people and vehicles in wilderness environments are of great relevance to border patrol applications (e.g., see [1]). However, conventional methods for deploying such sensor networks involve the use of complex, specialized, and expensive sensor node platforms. The specialized nature of such platforms leads to significant development and verification time, which slows down our ability to leverage the latest advances in hardware and software technologies. Moreover, the high cost of such specialized sensor nodes limits the scale at which they can be deployed and poses significant risk to soldiers or security personnel who need to periodically maintain or move the nodes.
In this paper, we address these challenges by developing a novel tracking system that operates on commodity mobile devices, specifically on Android-based tablet platforms. Mobile devices are attractive for use as prototypes and experimental environments for disposable sensor node platforms due to their low cost, widespread availability, and integration of advanced communications, sensing, and processing features. The concept of disposable sensor nodes for defense- and security-related intrusion detection is important because such devices can simply be discarded (“forgotten about”) when they are no longer operational. Thus, human lives do not have to be put at risk for their retrieval. However, application of disposable devices in mission-critical tracking applications is challenging due to their limited resources for processing and their limited battery capacity.
Extensive prototyping, testing, and iterative demonstration are needed to ensure that a developed tracking system is sufficiently accurate and efficient before committing resources to application-specific sensor node development. Adding customized hardware helps to further improve the system performance. However, before migrating to such custom solutions, it is critical to have a flexible prototyping environment so that a wide variety of operational configurations, potential features, and constraints can be considered before committing resources to developing an expensive, specialized hardware system.
With this motivation, we develop methods in this paper for optimized prototyping of human and vehicle detection systems on mobile platforms. Mobile platforms can easily be acquired and deployed in outdoor environments to support prototyping and experimentation; however, significant challenges must be addressed to provide levels of accuracy and efficiency in the prototypes that can provide adequate confidence in a system design before proceeding to specialized sensor node development and deployment. We address these challenges through novel system-level design optimizations that are targeted to resource constrained mobile devices and provide optimized trade-offs among energy consumption, real-time performance, and tracking accuracy.
In previous works, it has been demonstrated that acoustic sensors are effective for detection of people and vehicles (e.g., see [2–4]). However, acoustic-sensor-based tracking systems are sensitive to background noise. For example, wind noise or large distances between the target and the sensor can alter signal quality, and consequently, classifier performance may decrease. Apart from constraints on overall tracking system operation that are related to environmental conditions, mobile platforms have constraints related to limited memory, energy capacity, and computational resources. Therefore, it is important to optimize the use of available resources to maximize system accuracy, while taking into account the various platform constraints and environmental constraints. Furthermore, in such an implementation context, where diverse, multidimensional constraints—including tracking accuracy, real-time performance, energy consumption, and resource utilization—must be considered, it is important to develop multiobjective optimization analysis so that system designers can understand system-level trade-offs and select the most strategic deployment configurations.
Whereas existing approaches focus primarily on achieving high detection accuracy and reducing the false-positive rates of specific tracking algorithms, we focus in this paper on building on such approaches and developing a novel system-level solution that is geared to the unique challenges of mobile-platform-based tracking systems and provides powerful multiobjective optimization capabilities to help designers navigate the associated implementation design spaces.
Based on this motivation, we present in this work the design of a data-driven tracking system that integrates computational and measurement processes for optimized operation and reliability on mobile devices. Our design is developed by integrating state-of-the-art acoustic-sensor-based tracking algorithms—in particular, the algorithms presented in [2, 5]—with principles of dynamic, data-driven application systems (DDDAS) [6] and dataflow-based design and implementation of signal processing systems [7]. We refer to our new tracking system design as DDDAS-enabled Tracking System for Mobile Devices (DTSMD). DTSMD incorporates measurements throughout application operation to help the system adaptively select tracking algorithm configurations that are most strategic in terms of trade-offs among accuracy, energy efficiency, and real-time performance.
2 Related work
Various algorithms have been developed for acoustic-sensor-based detection of people and vehicles (e.g., see [4, 8–11]). In [8], a new method for the recognition of vehicle acoustic signatures was introduced and compared to conventional approaches that use Mel-frequency cepstral coefficients (MFCC) for feature extraction associated with hidden Markov models or Gaussian mixture models. The approach uses a probabilistic subspace classifier with features extracted based on the log magnitude of the short-term Fourier transform. The approach exhibits better performance than traditional algorithms and is demonstrated to have an 11.7 % error rate for a nine-class problem.
In [5], different extraction algorithms, including cepstral coefficients, principal component analysis, and symbolic dynamic filtering (symbolic DF), were tested with different classification algorithms on acoustic signals for detection of mortar launchers. The classification algorithms employed in this study included k-nearest neighbors, support vector machine (SVM), and sparse representation classification. Cepstral analysis and symbolic DF-based feature extraction together with SVM classification achieved relatively high accuracy in exchange for being computationally intensive.
In [2], cadence analysis and fast Fourier transform (FFT)-based human voice analysis were jointly applied on acoustic signatures for detection of people and animals. The multivariate Gaussian (MVG) algorithm was used for classification.
Compared to the approaches described above, distinguishing aspects of the DTSMD system developed in this paper include the following. First, DTSMD is optimized for energy-efficient, real-time operation on resource-constrained mobile platforms. This facilitates prototyping for large-scale, low-cost deployment, as motivated in Section 1. Second, DTSMD provides data-driven adaptation among different detection algorithms to optimize trade-offs involving detection accuracy, energy efficiency, and processing speed. The specific classifiers employed in our data-driven, multimode tracking system include both linear classifiers (MVG and SVM with linear kernel) and non-linear classifiers (SVM with Gaussian kernel). Different frequency-analysis-based feature extraction methods are also employed to further enhance the dynamic reconfigurability of the adaptation scheme in DTSMD. Specifically, we employ feature extraction alternatives that employ spectral analysis and cepstral analysis.
3 Tracking system design
In this section, we present the system design for DTSMD, our adaptive, mobile-device-targeted tracking system. The system distinguishes among vehicles, people, and a third class, which corresponds to a designated “noise class.” Detections in the noise class are interpreted as detected objects that are neither people nor vehicles. Such use of a noise class helps to reduce false alarms [11].
3.1 Design methodology
DTSMD is composed of four primary stages: signal pre-processing, target detection, feature extraction, and classification. The signal pre-processing stage incorporates filtering to remove noise. In the target detection stage, peaks are detected and detection intervals are determined. During target detection, careful attention is given to configuration of the detection interval, which is the time duration across which individual detection events are analyzed. Detection interval configuration involves a trade-off that affects extraction of robust features. If the interval is too large, interference between neighboring detections may result. If it is too small, key characteristics of the signal will not be included in the classification process. We address this trade-off by testing system performance in terms of accuracy for different interval lengths and different system configurations. For each configuration, we apply the interval length that is found through such testing to yield the best accuracy. If the configuration is changed dynamically, then the interval length is changed accordingly.
Feature extraction involves determining a set of features that facilitates the process of distinguishing among different kinds of targets. Feature extraction helps to simplify the classification problem by reducing the dimension of the processed data. A feature selection step can be added in order to further reduce the dimension of the feature set by removing redundant information. Integration of feature extraction and selection into DTSMD is done carefully to avoid excessive computational overhead on the targeted mobile device. The employed approaches for feature extraction and selection are discussed further in Section 3.3.
The final step is classification. Its task is to determine the category to which the detected target belongs. Here, we employ classifiers that are based on supervised machine leaning, where a training set is applied for each classifier. Each classifier operates on the training parameters, which are computed off-line, and the feature vectors, which are derived from the input data. It outputs an estimate of the class to which the detected target belongs. In this work, we consider three possible output classes: (a) person, (b) vehicle, and (c) noise (neither a person nor a vehicle).
3.2 Dataflow-based design approach
To derive an efficient and reliable implementation of the tracking system, we employ model-based design methods using signal processing dataflow techniques. Dataflow models are useful in the design and implementation of signal processing systems for a variety of important reasons, including their ability to expose application structure that facilitates hardware and software optimization [7]. Furthermore, dataflow representations can be applied to guarantee useful implementation properties, such as bounded memory requirements and deadlock-free operation [12]. For more details on the utility of dataflow methods in the context of resource-constrained sensor networks, we refer the reader to [13].
A dataflow graph model of an application consists of a set of actors (graph vertices), which correspond to computational functions, and flowgraph connections (edges), which correspond to FIFO buffers. These buffers provide logical data communication channels between the actors. On each execution (firing), an actor consumes data from its input edges and produces data onto its output edges. Each data item that is produced or consumed in this way is referred to as a token. On each firing, the specific numbers of tokens produced and consumed are referred to as the production and consumption rates or dataflow rates of the associated actor inputs and outputs. Dataflow rates may in general be constant or time-varying (e.g., due to data-dependent production and consumption behavior). The graphical structure of a properly constructed dataflow model along with information about dataflow rates within the model is important to analyze when mapping the model to an implementation [7].
For the design of DTSMD, we employ a specific form of dataflow modeling, called core functional dataflow (CFDF) [14]. In CFDF, the computation for each actor is decomposed into a set of modes, where each mode is required to have constant production and consumption rates. However, different modes of the same actor can have different dataflow rates, which allow designers to express actors that have dynamic dataflow behavior. This provision for dynamic behavior enhances the flexibility of the modeling format, while the constant dataflow rates associated with actor modes provide useful information that can be exploited to coordinate execution of the actors and manage memory that implements the edges.
Examples of the use of CFDF modes in DTSMD are the uses of different actor modes to implement alternative strategies for classification and feature extraction. These strategies are selected dynamically by activating the corresponding modes. These modes in turn are determined based on certain measurement results that are derived through instrumentation functionality that executes on the targeted mobile device. More details on our use of multimode classification, multimode feature extraction, and instrumentation are discussed in Section 4.
3.3 Dataflow model for DTSMD system
Our dataflow model for the DTSMD system employs the set S p = {p r , p s , p d , p f , p c , p o , p N } of global (system-level) parameters. These parameters influence the system performance in terms of accuracy, execution time, memory requirements, and power consumption. The meanings of these parameters are described as follows.
-
p r : record time, which corresponds to the size of a single frame of acoustic data for processing by the system.
-
p s : sampling rate, which is a characteristic of the employed sensing interface.
-
p d : detection interval, which corresponds to the duration of time (within a data frame) over which features are computed. The detection interval therefore determines the amount of information that is used for feature extraction.
-
p f : the number of features employed for classification. If feature selection is employed, then p f represents the reduced number of features that is available after feature selection.
-
p c : the number of classifications to perform for each detection. Since the acoustic signal is in general non-stationary, it is useful to extract the features over multiple overlapping windows that are of relatively short duration. The signals in these small frames can then be viewed as being stationary.
-
p o : window overlap, which specifies the amount of overlap (in time units) in case multiple classifications are performed for each detection. If each detection corresponds to just one classification, then this parameter is ignored.
-
p N : the number of classes. This is fixed to 3 in this system—corresponding to the vehicle, person, and noise classes. This parameter can be used when adapting the DTSMD system to other classification problems with different numbers of classes.
Figure 2 shows the initial dataflow model that we developed when developing DTSMD. This is a relatively natural mapping of the overall algorithm functionality into signal flowgraph form. However, due to significant levels of dynamics in the dataflow rates, buffer management (implementation of the dataflow graph edges) becomes prone to overhead, and the resulting implementation requires relative large amounts of memory. Moreover, edge e 6 contains the same data as edge e 1 (i.e., a “broadcast” copy of the data), which is inefficient, especially because the feature extraction actor does not need all of the raw data for its processing. The memory requirements for the individual dataflow edges are summarized in Table 1.
The buffer sizes were computed based on the numbers of tokens consumed and produced during each actor firing. Thus, these buffer sizes are in general dependent on the specific algorithm employed in each actor. For example, in Table 1, the buffer e 1 reads the input data recorded from the acoustic sensor. Therefore, the memory allocated to buffer e 1 corresponds to the length of the input data frame, which is determined as p r × p s , where p r is the recording time and p s is the sampling frequency. Buffer e 2 contains the filtered data. Since we apply a sliding window, the maximum amount of data that needs to be buffered on e 2 at one time is given by
Peak detection identifies the peaks and valleys in the smoothed signal, where each detected peak is paired with the nearest valley, as shown in Fig. 1. Here, the output signal length L o and input signal length L i are related by L o = (L i − 1). The target location actor outputs the starting and ending points of the detected interval sent through e 4 and e 5. For other buffers, such as e 8 and e 10, the memory size was not determined precisely in terms of the maximum number of tokens T max that need to be accommodated at any given time. Instead, an estimated upper bound on T max was employed because the output length is determined dynamically depending on the data, the number of targets detected in the input signal, and the computed number of classifications. This dynamics in the output length (and corresponding loss in predictability) is a negative aspect of this initial design that is improved upon in our optimized design. The size of e 9 corresponds to the number of generated training parameters. In this initial design, the naive Bayes classifier was employed. Edge e 11 transfers the output class and, thus, has a size of 1 token.

Localization steps to detect humans
To achieve better predictability and improve memory requirements and execution speed, we optimize the dataflow model for DTSMD by grouping together or “clustering” selected actors. The resulting clusters are implemented as monolithic blocks of optimized code—that is, they are combined into individual actors of increased complexity, while the overall dataflow graph is of somewhat reduced complexity, as shown in Fig. 3. In this optimized dataflow graph, production and consumption rates are of a more predictable parametric synchronous dataflow (parametric SDF) form, which means that for a given set of graph parameters, the dataflow rates are all constant. We distinguish our use of parametric synchronous dataflow modeling here from the parameterized dataflow meta-model [15], which is a more specialized dataflow modeling technique that is not employed in this work.
The use of parametric synchronous dataflow representations facilitates construction of efficient quasi-static schedules (e.g., see [7]). Here, by a schedule, we mean the body of embedded software that coordinates the execution of the actors in a dataflow graph. A quasi-static schedule is a schedule in which a significant portion of the schedule structure is fixed at design time, while some amount of scheduling dynamics is provided through limited use of run-time schedule adjustments. Compared to dynamic schedules, which involve relatively large execution time overhead and have poor predictability, quasi-static schedules can lead to significantly more efficient and reliable implementations.
In the transformed graph, we also modify the functionality so that the number of classifications per detection interval is statically fixed (using the parameter p c ). In the initial design, this number of classifications is computed dynamically to provide more robust operation. This dynamics, however, complicates buffer size analysis (particularly for edges e 8 and e 10 ) in the dataflow graph and leads to significantly larger buffer size requirements compared to use of a statically determined number of classifications. At the same time, we found through experiments that dynamically, determining the number of classifications does not lead to significant improvement in overall system accuracy. Based on this combination of dataflow graph analysis and experimentation, we converted the number of classifications to a statically fixed parameter (p c ).
The transformed dataflow graph, after application of clustering and after statically fixing the number of classifications, is illustrated in Fig. 3. The resulting profile of memory requirements for the dataflow edges is shown in Table 2. In addition to providing significant improvements in the memory requirements for the graph edges, as seen by comparing Tables 1 and 2, the total memory requirements for Fig. 2 (including graph edges and all other storage requirements) are also significantly improved by the transformed dataflow graph of Fig. 3. This impact on total memory requirements is discussed further in Section 5.

Initial dataflow graph

Optimized dataflow graph after clustering. The structure shown within the classification actor—with three concurrently executing binary classifiers connected to a voting function—corresponds to the second and third modes of the classification actor
The entries in Table 2 were computed using the same kind of reasoning as what was used to derive the entries in Table 1. We omit the details here for brevity.
The optimized dataflow model of Fig. 3 consists of the following actors.
-
Target detection: On each firing, this actor filters a window of samples in the input signal, detects peaks in the filtered signal window using an adaptive threshold, and outputs a detection interval. The detection interval indicates the range of time within the input window across which one or more signal peaks are detected. If no peaks are detected, then an empty (zero-duration) interval is produced as output.
-
Feature extraction: This actor operates on signal windows analyzed by the target detection actor that correspond to non-empty detection intervals. On each firing, a single signal window is analyzed. From this window, the feature extraction actor computes features for classification and selects the most significant features based on the current application settings for feature selection. This actor has three modes: spectral analysis, cepstral analysis, and mutual-information-based feature extraction. In the spectral analysis mode, the DC component is removed from the input window; the data are normalized to unit variance; and the FFT of the resulting signal envelope is computed. Cadence analysis is then applied to select the relevant features [2]. In the cepstral analysis mode, the DC component is also removed, and the cepstral coefficients are computed using the algorithm presented in [5], which can be viewed as a modified version of the original cepstrum algorithm [16]. In the third mode, the signal spectrum is computed and the features are selected based on mutual information using the algorithm described in [4].
-
Classification: This actor takes as input an extracted feature set and outputs an estimation of the output class from the given feature values. The actor has three modes that correspond to different classification algorithms: linear discriminant analysis (LDA), SVM with linear kernel, and SVM with Gaussian kernel. When applying an SVM classifier (i.e., in the second and third modes), we employ the one-against-one approach described in [17] to convert binary outputs from the SVM classifier into the desired multiclass form where we must discriminate among vehicles, people, and noise. In this case, three different instances of the SVM classifier are executed to perform binary classifications between pairs of candidate classes (vehicle vs. person, vehicle vs. noise, and person vs. noise). These three instances are executed concurrently using the multiple processing cores on the targeted Android device (discussed further in Section 5). The three binary classification results are then processed by a voting operation to determine the estimated multiclass result. If the application is executed in the LDA mode, then only one classification instance is executed, and no voting is applied.
-
Results actor: computes the mean value of the output classes in case p c ≥ 1. If p c = 1, then the results actor performs no computation and simply propagates the received (single) output class to its output edge.
The feature extraction algorithms employed in our system apply FFT computations. For this purpose, we use the fftw3 library in our implementation, which in turn employs an algorithm that has a runtime complexity of O(nlog(n)) for an input vector of length n [18]. The feature extraction algorithms that we use have O(n) complexity, while the cepstral coefficients algorithm performs more operations than in the case of spectral analysis. For classification, the prediction part of the SVM algorithm implemented in LIDE-C has O(n) complexity, where n is the size of the input feature vector. The employed LDA approach has a complexity of O(n 2).
Algorithm 1 shows a pseudocode representation of the quasi-static schedule employed to coordinate execution of the DTSMD system. Here, the File Writer actor is added to write the output results to a text file for convenience in interpretation and validation of the results.
In Algorithm 1, the syntax “fire X in mode Y” represents the execution of actor X using the CFDF mode Y of the actor; “mode cepstral” represents the cepstral analysis mode; and “mode mutual” represents the mode that employs mutual-information-based feature extraction.

4 Adaptation approach
Since our tracking application is targeted to mobile platforms, which have limited resources, it is important that we view it comprehensively as a multiobjective design problem (e.g., see [19]). Apart from developing a tracking application with good output accuracy, it is important that we also optimize memory requirements, power consumption, and execution time. Therefore, we apply design methods and optimization techniques that take all of these metrics into account.
On the one hand, mobile devices have limited battery capacity. Therefore, it is important to consider battery capacity as a constraint and to employ algorithms that do not take excessive amounts of computing time and are energy-efficient. On the other hand, acoustic signals are highly sensitive to noise, and therefore, we consider the signal to noise ratio (SNR) as a key operational metric, as it influences overall system accuracy. Various factors influence SNR, such as the distance between the sensor and the target, and environmental noise (e.g., from wind). Therefore, it is important in our application to choose classifiers and feature extraction algorithms that have good performance when processing noisy signals.
We propose here a tracking system design that adapts itself based on operating conditions and environmental constraints in order to effectively target the optimization objectives of energy efficiency and detection accuracy.
Our adaptive system design is developed by providing a set of four alternative execution modes in which the tracking engine can operate. These modes provide different trade-offs that can be selected and switched among at run-time to align system operation with current operating conditions and constraints. These modes and the coordination among them are illustrated in Fig. 4. The four modes are represented in Fig. 4 by four distinct states: S 1, S 2, S 3, and S 4. The states S 1, S 2, and S 3 are executed when the SNR level of the detection signal (the signal at the output of peak detection) is relatively high, while the state S 4 is assigned to the low-SNR scenario.

Finite state machine for multimode control of the tracking application
In case of high SNR, the default state in which the system executes is S 1, while the states S 2 and S 3 can be viewed as energy-saving modes. When the battery level is low, the system shuts down gradually by first switching to S 2 and then to S 3 to reduce power consumption in exchange for a lower accuracy. We do not implement a separate energy-saving mode for the low-SNR case. This is because the low-SNR state S 4 already has relatively low energy consumption. Furthermore, reducing power consumption in this situation would lead to unacceptably low tracking accuracy. The transitions between the states depend on the threshold values T s , T b1, and T b2 , which correspond, respectively, to thresholds on the SNR level and the remaining battery capacity. These thresholds can be fixed by the designer and, if desired, changed in the field by the user.
In the low-SNR state S 4, the signal spectrum is computed and a feature selection algorithm based on mutual information is applied in order to identify key features. Detecting human cadence in low-SNR scenarios is challenging because steps in the detection segments may be hidden by noise, which makes fewer steps available for the detection analysis.
In tracking applications, the choice of a robust feature extraction method is as important as the choice of a good classification algorithm [20]. The interval length is also an important parameter that has influence on the classification accuracy [9]. Therefore, we consider three parameters for configuring the states in Fig. 4: the classifier mode, feature extraction mode, and detection interval. Note that the “modes” referenced in these parameter names are different from the “application modes” that correspond to the four states illustrated in Fig. 4.
Table 3 summarizes the parameter values for each of the application modes in our adaptive tracking system. We tested application performance in terms of detection accuracy for different values of these parameters. Based on this experimentation, we chose the parameter combinations that provided the best recognition performance. In the case of low SNR, we chose a small interval length compared to the other states. This is because under low SNR, each detection interval contains a relatively smaller amount of acoustic information. In order to compute the SNR, the noise energy is measured first since this value strongly depends on the environment where the recordings are performed. For example, a recording without any detection can be performed in order to measure the environmental noise energy.
The FSM shown in Fig. 4 is implemented as a separate actor that we call the decision actor. The decision actor is executed after the target detection actor to compute the SNR level of the detected signal. It also reads the current battery level. Based on the measured SNR and battery levels, the decision actor determines whether to stay in the current application mode (FSM state) or to transition to a different state that is more effective in terms of the current SNR and battery conditions. Upon making a state transition, the decision actor computes the values of the classifier mode, feature extraction mode, and detection interval parameters to employ in the new state.
5 Experiments
5.1 Implementation details
In order to test and experiment with our tracking application design, we implement the actors in LIDE-C, which is the C-language version of the DSPCAD Lightweight Dataflow Environment [21, 22]. LIDE is a software tool that facilitates model-based design and implementation of signal processing systems in terms of dataflow graphs. Our experiments are performed on an Android-based device (Nexus 7 tablet, 2012) that is equipped with a quad-core Tegra 3 processor. We use the tablet’s microphone as the acoustic sensor. In our tests, the recorded data is saved as.pcm files, and we use a file reader actor to read the acoustic data. A file reader is an actor in LIDE that injects tokens into a dataflow graph based on data read from an input file. The training of the classifiers that we use is performed offline in MATLAB. The classifier parameters that are generated from training are stored in a text file. This text file is then read by the associated classifier actor to configure the classifier before execution.
With one possible exception, the actors are executed sequentially following a quasi-static schedule, as described in Section 3. The exception occurs in case the SVM classifier is selected. In this case, three binary classification actors are executed concurrently to carry out different parts of the required multiclass classification task. To implement these concurrent SVM executions, we use the pthreads library [23] to schedule each binary classification actor on a separate thread.
5.2 Data collection
In order to test our approach, we collected data at the University of Maryland campus during different days and, consequently, for different weather conditions. We considered distinct scenarios when recording the data, including (a) a single walking person, (b) a group of walking people, (c) a running person, and (d) a moving vehicle. For case (d), both heavy and light vehicles were considered. We recorded data from various persons including both males and females. The distance between the tablet and the people varied from 15 cm to 1 m and between the tablet and vehicles varied from 1 to 3 m.
These limited-distance ranges in our experimentation are due to the relatively low-cost sensor subsystems that are incorporated into commodity mobile devices. The ranges can be extended considerably with more advanced sensor technology when migrating the prototype design to the final implementation. However, for prototyping-stage experimentation, the limited-distance operation supported by the targeted commodity mobile devices is sufficient to assess and experiment with a wide range of system design trade-offs.
Our collected dataset contains in total 143 acoustic files, which we used to generate 539 training data signals and 209 testing data signals. The SNR level of the data varies. For these experiments, we set the SNR threshold T s value to 6 dB.
5.3 Comparison between the developed designs
We measure the memory footprint of the two designs that we presented in Section 3—the original functional prototype design and the transformed design that is optimized for efficient implementation. Since the majority of the memory space the application is accessing is dynamically allocated (heap memory), we present here the heap allocation, which is the total amount of heap memory reserved by the application through memory allocation requests, and the heap size, which corresponds to the total heap size allocated for the application. These results are summarized in Table 4. These results include the effects of memory allocation requests that are involved in setting up data structures associated with the dataflow graph, including the FIFO buffers and actors, when the graph is constructed during the application initialization phase. The FIFOs use about 80 % of the heap allocation in the initial design, while they only use about 39 % of the heap allocation in the second, optimized design.
5.4 Evaluation of the adaptive tracking application
We used the following parameter values in our experiments:
-
p r = 28 s
-
p s = 8 kHz
-
p f = 50 tokens
-
p c = 1 token
-
p N = 3
-
p fw = 1000 tokens
-
p fo = 800 tokens
For state S 1, we extract the first p f features. For states S 2 and S 3, we extract the first (lowest frequency) p f FFT points, which corresponds to a resolution up to 12.5 Hz. This level of resolution is sufficient for detecting human cadence. For state S 4, we extract p f features using the mutual-information-based feature selection algorithm.
We measure the energy consumption of our tracking system implementation in each operating mode. We also measure the accuracy, and the area under the curve (AUC), which is the area under the receiver operating characteristic. Additionally, we analyze the confusion matrices for following three situations:
-
The system operates in a static configuration based on the settings of state S 1 (MFCC, SVM rbf, 6 s).
-
The system operates in a static configuration based on the settings of state S 4 (mutual information, SVM rbf, 3 s).
-
The system operates using the adaptive approach described in Section 4, except that the energy saving modes described in Section 4 are not used. Figure 5 illustrates the reduced-functionality version of the adaptive approach that we evaluate in these experiments. The energy saving modes are defined for graceful shutdown of the system as battery capacity expires; thus, we do not consider these modes in these experiments, which focus on steady state (“fully powered”) operation of the tracking system.
Fig. 5 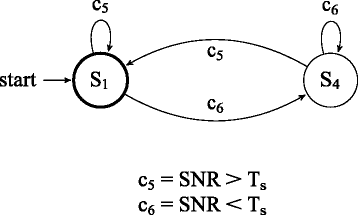
FSM for the steady state or fully powered part of the tracking application

For these experiments, two parameters have been tuned for the SVM classifier: σ, which corresponds to the width of the radial basis and C, which represents the penalty for misclassification.
The energy consumption results from our experiments are summarized in Table 5. We see from these results that states S 2 and S 3 consume less power than S 1, and thus can be used to save energy, and are suitable for use as intermediate states between (a) fully powered operation and (b) system shutdown due to battery expiration. From Table 5, we also notice that the detection interval has a strong influence on energy consumption. In states S 2 and S 3, the interval length is the same (4 s) and the difference in the energy consumption is small compared to, for example, the difference between states S 1 and S 2, where the interval length in S 1 is 6 s.
Since we consider here a multiclass classification problem, we compute a composite, multiclass AUC metric, which we denote as MAUC (multiclass AUC). MAUC is a commonly used metric for assessing multiclass approaches. To compute the MAUC, we first compute the AUC for each binary classification task performed (vehicle vs. noise, vehicle vs. person, and person vs. noise). MAUC is then computed using Eq. 1 (shown below), which is discussed in [24], and is based on an approach introduced in [25].
Here, N c is the number of classes, C is the set of output classes, and AUC(c i ,c j ) is the AUC for the binary classification task defined by the classes c i and c j .
Results on accuracy and MAUC are summarized in Table 6. The adaptive approach has a better accuracy compared to the fixed-mode (statically configured) approaches in which only one classifier and one feature extraction method are employed. From Table 6, we see that our proposed adaptive solution has the highest MAUC value.
In Table 7, the confusion matrices of the three possible solutions are presented. The columns correspond to the estimated class, and the rows correspond to the actual class. We see that the adaptive approach yielded 191 correct detections, while the states S 1 and S 4 have given, respectively, 176 and 167 correct outputs.
6 Conclusions
In this paper, we have presented the design and implementation of an adaptive system for detecting and tracking human footsteps and vehicles from mobile devices. Such a mobile-device-based system is motivated by important uses in the prototyping, testing, and demonstration of disposable sensor nodes that are targeted for deployment in border security and other kinds of outdoor intrusion detection applications. Developing and experimenting with flexible prototypes allows signal processing system designers to perform in-the-field validation and to evaluate alternative features, parameter configurations, and trade-offs before committing resources to finalize the implementation on custom hardware sensor nodes. These are important capabilities given the complexity of practical tracking systems and the high costs of developing application-specific sensor node solutions.
We have presented a model-based design approach for our proposed tracking system using signal processing-oriented dataflow techniques. We have shown how analysis and transformations using the resulting dataflow model help to understand characteristics of and optimize the targeted implementation. We have performed extensive experiments on an Android-based implementation of our tracking system and presented a multiobjective analysis of the experimental results. This analysis has focused on assessing design optimization quality in terms of tracking accuracy and energy efficiency. Unlike conventional approaches for related tracking problems that are based on single-classifier implementations, our proposed system adapts among different classification and feature extraction algorithms depending on existing operational conditions. Interesting directions for future work include investigating and integrating feature extraction methods that are more robust against noise and extending our adaptive, mobile-device-based tracking system to apply multiple sensing modalities (e.g., seismic sensor data in conjunction with acoustic data).
References
T Damarla, LM Kaplan, A fusion architecture for tracking a group of people using a distributed sensor network, in Proceedings of the International Conference on Information Fusion, 2013, pp. 1776–1783
T Damarla, A Mehmood, J Sabatier, Detection of people and animals using non-imaging sensors, in Proceedings of the International Conference on Information Fusion, 2011, pp. 1–8
RE Bland, Acoustic and seismic signal processing for footstep detection, Master’s thesis, Massachusetts Institute of Technology, 2006
B Guo, MS Nixon, TR Damarla, Acoustic information fusion for ground vehicle classification, in Proceedings of the International Conference on Information Fusion, 2008, pp. 1–7
BM Smith, P Chattopadhyay, A Ray, S Phoha, T Damarla, Performance robustness of feature extraction for target detection & classification, in Proceedings of the American Control Conference, 2014, pp. 3814–3819
F Darema, Dynamic data driven applications systems: a new paradigm for application simulations and measurements, in Proceedings of the International Conference on Computational Science, 2004, pp. 662–669
SS Bhattacharyya, E Deprettere, R Leupers, J Takala (eds.), Handbook of signal processing systems, 2nd edn. (Springer, New York, 2013). ISBN: 978-1-4614-6858-5 (Print); 978-1-4614-6859-2 (Online)
ME Munich, Bayesian subspace methods for acoustic signature recognition of vehicles, in Proceedings of the European Signal Processing Conference, 2004, pp. 2107–2110
P Huang, T Damarla, M Hasegawa-Johnson, Multi-sensory features for personnel detection at border crossings, in Proceedings of the International Conference on Information Fusion, 2011, pp. 1–8
SG Iyengar, PK Varshney, T Damarla, On the detection of footsteps based on acoustic and seismic sensing, in Proceedings of the IEEE Asilomar Conference on Signals, Systems, and Computers, 2007, pp. 2248–2252
MF Duarte, YH Hu, Vehicle classification in distributed sensor networks. J. Parallel Distrib. Comput. 64(7), 826–838 (2004)
EA Lee, TM Parks, Dataflow process networks. Proceedings of the IEEE, 1995, pp. 773–799
SS Bhattacharyya, W Plishker, N Sane, C Shen, H Wu, Modeling and optimization of dynamic signal processing in resource-aware sensor networks, in Proceedings of the Workshop on Resources Aware Sensor and Surveillance Networks in Conjunction with IEEE International Conference on Advanced Video and Signal-Based Surveillance, Klagenfurt, Austria, 2011, pp. 449–454
W Plishker, N Sane, M Kiemb, K Anand, SS Bhattacharyya, Functional DIF for rapid prototyping, in Proceedings of the International Symposium on Rapid System Prototyping, Monterey, California, 2008, pp. 17–23
B Bhattacharya, SS Bhattacharyya, Parameterized dataflow modeling for DSP systems. IEEE Trans. Signal Process. 49(10), 2408–2421 (2001). doi:10.1109/78.950795
DG Childers, DP Skinner, RC Kemerait, The cepstrum: a guide to processing. Proc. IEEE 65(10), 1428–1443 (1997)
C Hsu, C Lin, A comparison of methods for multiclass support vector machines. IEEE Trans. Neural Netw. 13(2), 415–425 (2002)
M Frigo, SG Johnson, The design and implementation of FFTW3. Proc. IEEE 93(2), 216–231 (2005)
BE Bjornson, EA Jorswieck, M Debbah, B Ottersten, Multiobjective signal processing optimization: the way to balance conflicting metrics in 5G systems. IEEE Signal Process. Mag. 31(6), 14–23 (2014)
A Mehmood, VM Patel, T Damarla, Discrimination of bipeds from quadrupeds using seismic footstep signatures, in Proceedings of the IEEE International Geoscience and Remote Sensing Symposium, 2012, pp. 6920–6923
C Shen, W Plishker, H Wu, SS Bhattacharyya, A lightweight dataflow approach for design and implementation of SDR systems, in Proceedings of the Wireless Innovation Conference and Product Exposition, Washington DC, USA, 2010, pp. 640–645
C Shen, W Plishker, SS Bhattacharyya, Dataflow-based design and implementation of image processing applications, in Multimedia Image and Video Processing, ed. by L Guan, Y He, S Kung, 2nd edn. (CRC Press, Boca Raton, 2012), pp. 609–629. Chapter 24
DR Butenhof, Programming with POSIX threads (Addison-Wesley Professional, Boston, 1997)
T Fawcett, An introduction to ROC analysis. Pattern Recogn. Lett. 27(8), 861–874 (2006)
DJ Hand, RJ Till, A simple generalisation of the area under the ROC curve for multiple class classification problems. Mach. Learn. 45(2), 171–186 (2001)
Author information
Authors and Affiliations
Corresponding author
Additional information
Competing interests
The authors declare that they have no competing interests.
Rights and permissions
Open Access This article is distributed under the terms of the Creative Commons Attribution 4.0 International License (http://creativecommons.org/licenses/by/4.0/), which permits unrestricted use, distribution, and reproduction in any medium, provided you give appropriate credit to the original author(s) and the source, provide a link to the Creative Commons license, and indicate if changes were made.
About this article

Cite this article
Ben Salem, H., Damarla, T., Sudusinghe, K. et al. Adaptive tracking of people and vehicles using mobile platforms. EURASIP J. Adv. Signal Process. 2016, 65 (2016). https://doi.org/10.1186/s13634-016-0356-9
Received:
Accepted:
Published:
DOI: https://doi.org/10.1186/s13634-016-0356-9